


1. INTRODUCTION
Transparent polycrystalline ceramics have recently emerged as advanced structural and functional materials of high importance [1], because such ceramics can often be excited by laser diode pumping systems, making them suitable for numerous applications in diverse areas of industry [2]. Non-linear optics–based high-power lasers emitting in the infrared range of 2–5 μm usually contain Ho3+-doped transparent ceramics as a gain medium. A great deal of research is currently focused on fabricating lasers based on Ho3+-doped ceramics for applications such as atmospheric pollutant monitoring, remote sensing, lidar, and medical surgery [3-5].
The luminescence efficiency of solid-state lasers is closely related to the fluorescence characteristics of their gain media. Based on changes in the incident and released photon wavelengths, that fluorescence is classified as either downconversion or upconversion. In the former case, two or more low-energy photons are produced from one high-energy photon [6], while in the latter case, low-energy photons are converted into a high-energy photon in an anti-Stokes process [7,8]. Among the various ions, Ho3+ show the highest upconversion photoluminescence efficiency due to their long fluorescence lifetime and the large region of stimulated luminescence [9]. Yb3+ ions are very easily excited by 980 nm radiation, and the energy of this radiation can be easily transferred to other ions [10]. This implies that the upconversion efficiency of Ho3+ can be significantly increased in the presence of co-doped Yb3+ [11].
The luminescence efficiency of fluorescent substances is greatly affected by the phonon energy of the host matrix, since the extent of non-radiative energy loss, and hence, that of quenching, decreases with decreasing phonon energy. Consequently, Y2O3 is viewed as a promising material for upconversion lasers in view of its high thermal conductivity, ideal physical/chemical stability, suitability for doping with trivalent rare-earth-element ions, high transparency in a broad spectral range (infrared to visible-light regions), and relatively low phonon energy (430–550 cm−1) [12].
In general, most gain media used in solid-state lasers are of the single-crystal type [13]. However, the high melting point (~2430 °C, close to the melting point of Ir crucibles (2450 °C)) of Y2O3 and the occurrence of a cubic-to-hexagonal Y2O3 phase transition at 2350 °C complicate the fabrication of single crystals with high optical quality by conventional techniques such as the Czochralski method [14]. On the other hand, research has recently been directed at using Y2O3 transparent ceramics as laser media, as these materials exhibit the advantages of simple fabrication, low cost, uniform dopant concentration, and excellent mechanical properties [15].
Y2O3 transparent ceramics are fabricated using sintering methods such as hot pressing [16], hot isostatic pressing [17,18], and pressureless sintering [19-21]. In particular, spark plasma sintering (SPS) has the benefits of rapid temperature increase up to 2000 °C, accelerating the formation of necks between powder grains, and crystal grain surface purification, thermal diffusion, and electrotransport effects. This allows the process to achieve complete sintering in a very short time and at a low temperature [22-27].
Transparent ceramics are commonly manufactured using sintering aids, which govern the microstructure of these ceramics and can be used to increase their optical quality and promote densification. For example, the use of La2O3 in the sintering of Y2O3 ceramics results in improved transmissivity, as the former oxide induces grain growth and promotes densification by increasing grain boundary mobility [28] and thereby facilitates the annihilation of oxygen vacancies between grain boundaries [29].
In this study, we employed SPS in the presence of sintering aids to fabricate high-quality Ho3+,Yb3+-co-doped Y2O3 transparent ceramics suitable for use as a laser gain medium and analyzed their microstructure and optical properties. In particular, we confirmed the effect of Yb3+ content on photoluminescence intensity, excitation spectrum intensity, and fluorescence lifetime under 447 nm excitation. We further studied the photoluminescence intensity and the related emission mechanism at 545 and 655 nm under 980 nm excitation, and evaluated the effects of incident light intensity on output fluorescence intensity.
2. EXPERIMENTAL PROCEDURE
2.1. Sample preparation
High-purity Y2O3 (99.99%; Cenotec, Korea), La2O3 (99.9%; Kojundo, Japan), Ho2O3 (99.9%; Rare Metallic Co., Ltd., Japan), and Yb2O3 (99.9%; Shin-Etsu Chemical, Japan) powders were used. A mixture of La2O3 (1 mol%), Ho2O3 (1 mol%), Yb2O3 (0–3 mol%), and Y2O3 (balance) powders was ball-milled for 24 h with 1.5-mm-diameter zirconia balls at a 1:10 weight ratio and subsequently dried at 60 °C in an electric oven for 24 h. The dried powder was placed into a graphite foil–wrapped graphite die (internal diameter = 15 mm) and sintered at a temperature of 1625 °C, a vacuum of 10 Pa, and a uniaxial pressure of 30 MPa (Fig 1) using an S-515S SPS system (Sumitomo Coal Mining, Japan).
Three sintering processes were employed. Under process (I), the sample was heated from room temperature to the final sintering temperature (1625 °C) at a heating rate of 100 °C min−1 and then held at this temperature for 15 min; under process (II), pressure was maintained at 30 MPa from the beginning. Under process (III), after sintering was complete, pressure was released at 1100 °C, and the electric current was blocked.
The sintered specimens (diameter = 15 mm, thickness = 1 mm) were annealed for 4 h under an oxygen atmosphere in a box furnace at 1000 °C using a heating rate of 10 °C min−1. For microstructure and optical characteristics evaluation, both specimen sides were subjected to surface-grinding and then polished with 1 μm diamond paste.
2.2. Characterization
Crystal phase composition was determined using X-ray diffraction (XRD; Rigaku-denki, D/MAX-2500, Japan; Cu Kα, 40 kV, 30 mA) analysis in a 2θ range of 20–80°. The average grain size was determined by field-emission scanning electron microscopy (FE-SEM; NOVA Nano SEM 450, FEI, Czech Republic) at acceleration voltages of 5–15 kV. In-line transmittance and absorption were measured in a wavelength range of 300–2000 nm using a UV-Vis-NIR spectrophotometer (Lambda 950, Perkin-Elmer, USA). Irradiation at 980 nm was performed at room temperature employing an MDE981H8 laser (Latech Co., Korea), and the resulting upconversion emission was recorded in a wavelength range of 300–800 nm using a fluorescence spectrometer (LS55, Perkin-Elmer, USA). For fluorescence lifetime measurement, samples were irradiated at 445 nm and room temperature using a time-correlated single-photon counting spectrofluorometer (iHR320, Horiba, Japan) and a Xe lamp, and the resulting downconversion emission was measured.
3. RESULTS AND DISCUSSION
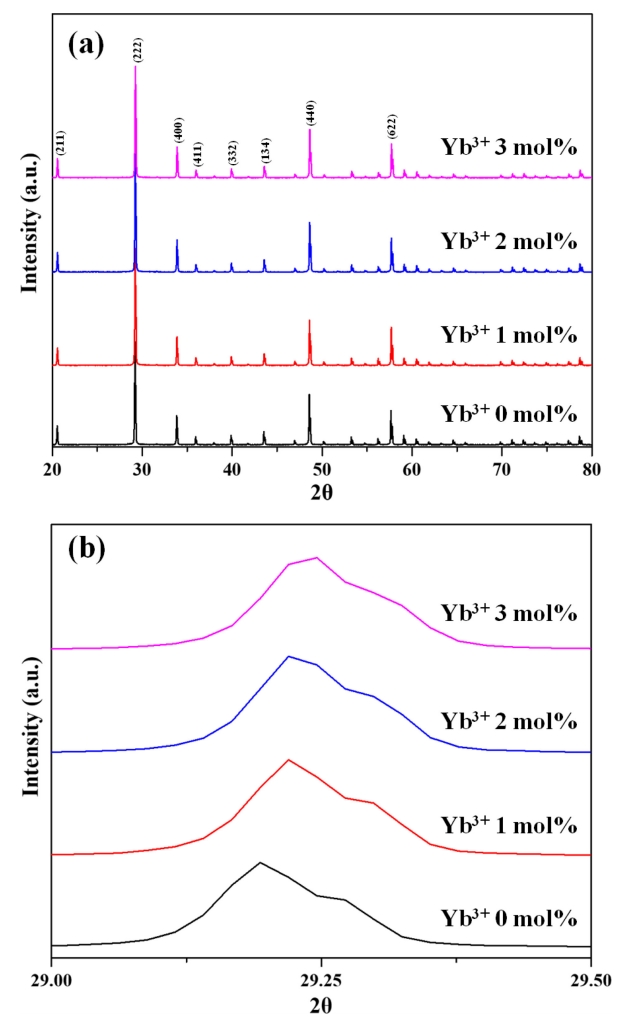
The XRD patterns of vacuum-sintered (1625 °C, 30 MPa, 15 min) Y2O3:Ho3+,Yb3+ specimens with different Yb3+ contents (Fig 2(a)) showed the presence of standard cubic Y2O3 (JCPDS Card No 41-1105) in all cases, with no other impurities were detected. La2O3 was found to be completely dissolved in Y2O3, and Ho3+ (1 mol%) and Yb3+ (0–3 mol%) matched perfectly with the space group I a 3 ¯
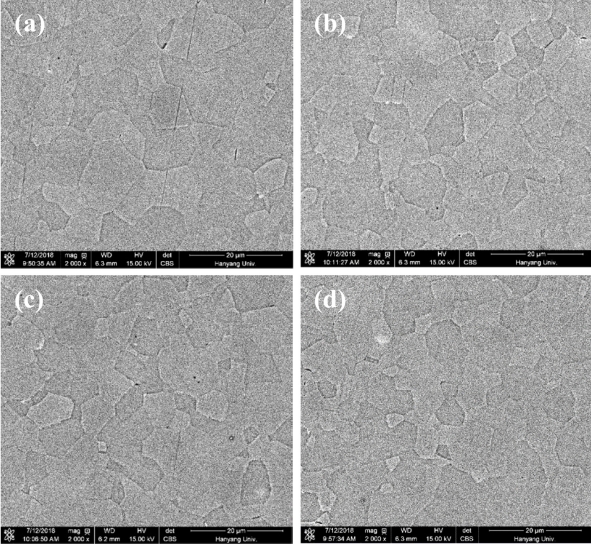
FE-SEM imaging of the etched surface of the Y2O3:Ho3+,Yb3+ ceramics (Fig 3) confirmed that all specimens exhibited a relatively fine and uniform microstructure without abnormal growth. The average grain size (~13 μm) was found to be independent of Yb3+ content. This finding confirmed that the content of Yb3+ does not have a large effect on the sinterability of Y2O3, since Yb2O3 and Y2O3 have similar crystal structures, and the corresponding selfdiffusion coefficients are of the same order [31].
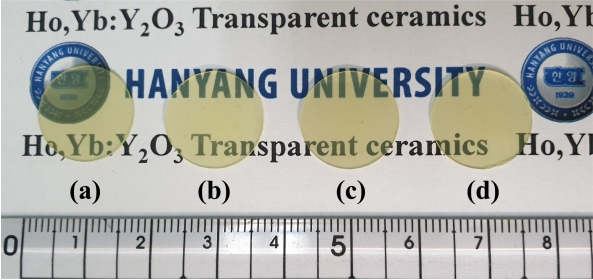
Figure 4 shows a photograph of the 1-mm-thick Y2O3:Ho3+,Yb3+ specimens, both sides of which were mirrorfinished after vacuum sintering (1625 °C, 30 MPa, 15 min) and annealing (1000 °C, 4 h, air). All of the specimens were transparent enough to allow one to read text placed behind them.
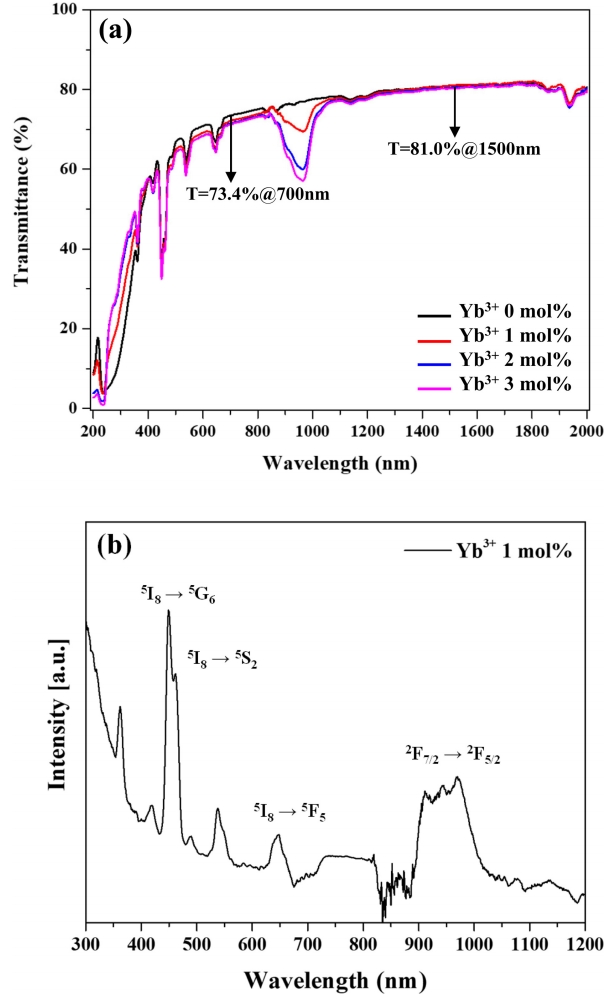
Figure 5(a) shows the transmission spectra of all samples, while Fig 5(b) shows the absorption spectrum of the 1 mol% Yb3+ specimen, revealing that this specimen exhibited transmissivities of 73.4 and 81.0% at wavelengths of 700 and 1500 nm, respectively. Thus, relatively high transmissivity was quickly achieved through the addition of a sintering aid (1 mol% La2O3) which accelerated mass transport during sintering. The absorption spectrum of the 1 mol% Yb3+ specimen featured peaks at 450, 540, 650, and 980 nm, which were ascribed to the 5I8 → 5G6, 5S2, F5 transitions of Ho3+ and the 2F7/2 → 2F5/2 transition of Yb3+, respectively [32]. Importantly, transmissivity at 980 nm decreased with increasing Yb3+ content of, which indicates that this ion absorbed radiation at 980 nm and transferred its energy to a different ion.
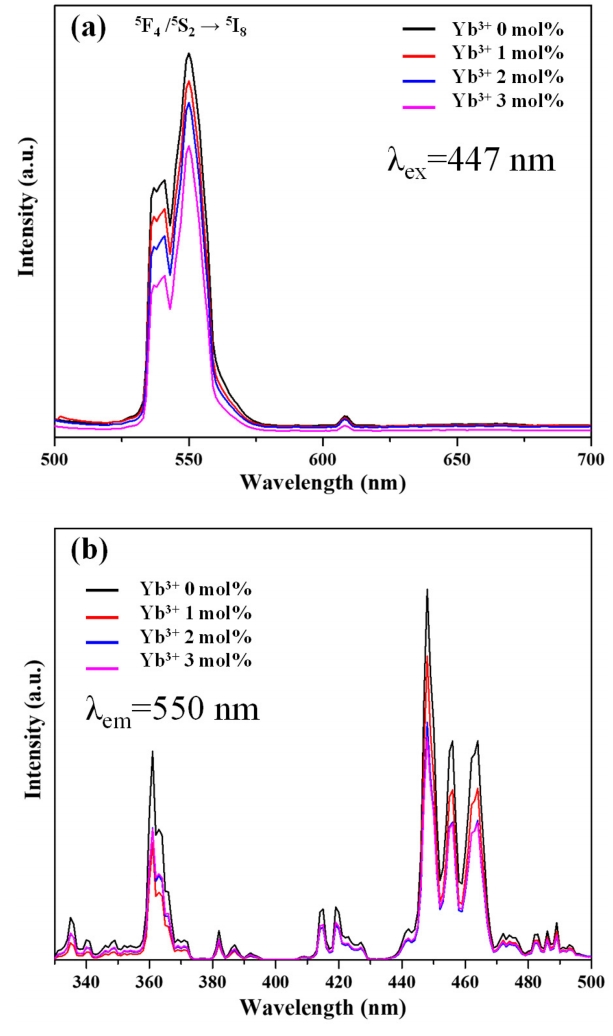
Figure 6(a) shows the effect of Yb3+ content on down-conversion photoluminescence intensity. Irradiation at 447 nm resulted in strong green photoluminescence (540 and 555 nm) and weak red photoluminescence (615 nm), with the former corresponding to the 5F4, 5S2 → 5I8 transitions of Ho3+, respectively [33]. With the introduction of Yb3+, photoluminescence intensity decreased in all regions. This behavior was attributed to the fact that the 2F5/2 level of Yb3+ is positioned between the 5I5 and 5I6 levels of Ho3+, which precludes the immediate relaxation of the latter ions to the ground state and results in cross-relaxation at the level of Yb3+, and, hence, in a decrease of Ho3+ emission energy [34].
Figure 6(b) shows the effect of Yb3+ concentration on the excitation spectrum for the 550 nm emission and reveals the presence of numerous transitions between 330 and 500 nm, e.g., 5I8 → 3H5, 5G2; 5I8 → 5G4, 3K7; 5I8 → 5G5; 5I8 → 5G6; 5I8 → 5F2, 3K8; 5I8 → 5F3. Notably, the intensity of all signals decreased with increasing Yb3+ content, which was attributed to a concomitant increase in cross-relaxation occurrence frequency. In turn, this frequency increase resulted in the depopulation of 5F4/5S2 and 5F5 levels and hence hindered downconversion photoluminescence at 550 nm [35].
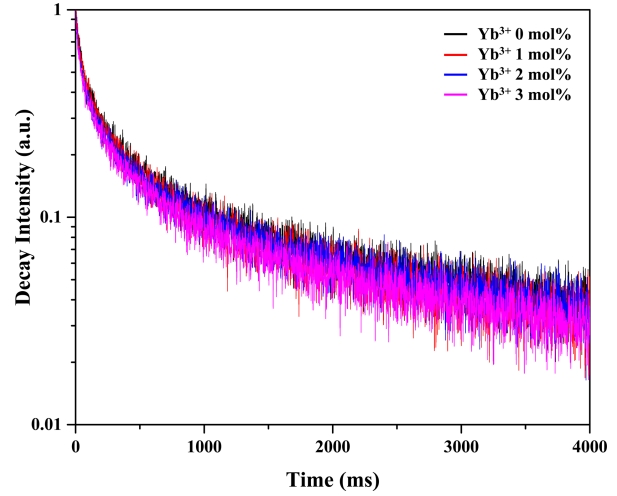
Figure 7 shows the effect of Yb3+ content on fluorescence decay curves. These curves were fitted using a linear exponential function, and decay times of ~140, 125, 110, and 100 μs were obtained for Yb3+ contents of 0, 1, 2, and 3 mol%, respectively. As a result, the decay time decreased with increasing Yb3+ content, an effect ascribed to the provision of a new decay pathway by the Yb3+ ions, i.e., these ions facilitated the relaxation of Ho3+ [36].
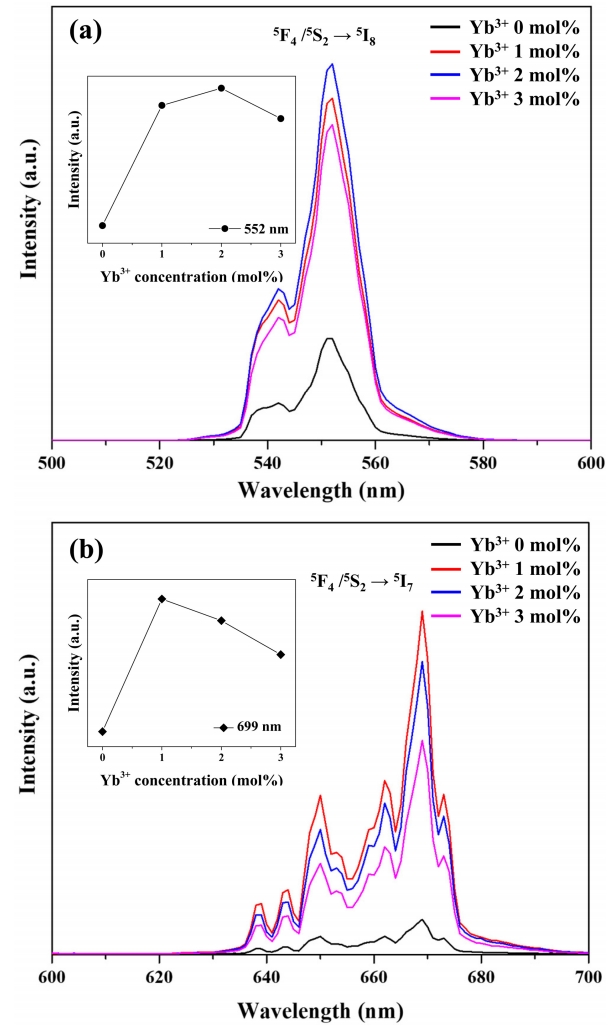
Figure 8 shows the effect of Yb3+ content on the upconversion photoluminescence of Y2O3:Ho3+,Yb3+. Irradiation of the above samples at 980 nm resulted in strong green photoluminescence (552 nm) and weak red photoluminescence (669 nm). The former photoluminescence corresponds to the 5F4, 5S2 → 5I8 transitions of Ho3+, while the latter is ascribed to the 5F5 → 5I8 transition of Ho3+ [37]. This behavior reflected the occurrence of an upconversion process, in which Ho3+ absorbs low-energy photons at 980 nm and emits higher-energy photons at 552 and 669 nm [32]. Doping with Yb3+ significantly increased photoluminescence intensity in all regions, with the largest increase observed for 2 mol% Yb3+. Notably, photoluminescence intensity decreased when going from 2 mol% to 3 mol% Yb3+. This is attributed to the enhancement of non-radiative transitions caused by interactions between Yb3+ ions at high Yb content [38].
Figure 9 shows that, like the upconversion photoluminescence intensity, green and red emission intensities increased with increasing near-infrared excitation power. Previously, upconversion photoluminescence intensity was found to be proportional to the n-th power of pump power. Here, the dependence of photoluminescence intensity (IIntensity) on excitation intensity (Ipump) was modeled as IIntensity ∝ Ipumpn, where n is a constant [39]. The slopes (i.e., values of n) of each trend line in Fig 9 are summarized in Table 1.
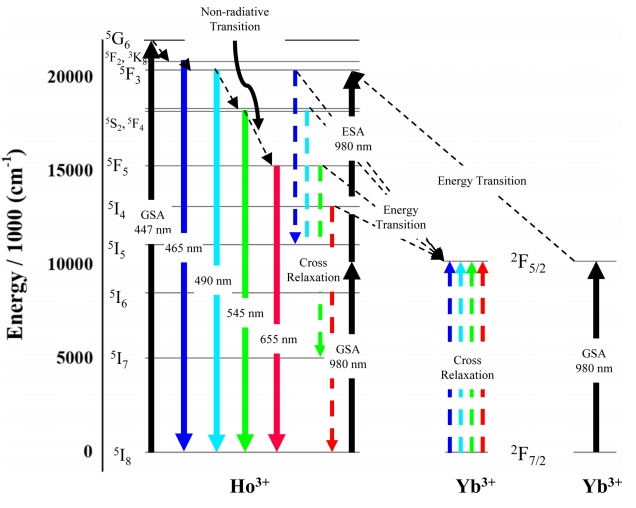
Figure 10 shows the mechanism of fluorescence upon the excitation of Ho3+ and Yb3+ ions at 447 or 980 nm. In the case of downconversion (excitation at 447 nm), ground-state (5I8) electrons are excited to the 5G6 level via the ground state absorption (GSA) process [11], which is followed by slow transitions to lower-lying levels (e.g., 5F2/3K8, 5F3, 5S2, and 5F5) through several stages of non-radiative transfer. Eventually, the ground state is re-populated, and the initially absorbed energy is released [33]. The presence of Yb3+ ions facilitates cross-relaxation which is characterized by the 5F3 → 5I5 and 5F5 → 5I7 transitions of Ho3+ [34].
With increasing Yb3+ content, the fluorescence induced by 447-nm excitation disperses to various wavelengths, which results in a decrease in fluorescence intensity in the visiblelight region as shown in Fig 6. Under 447 nm excitation, the interception of energy from the Yb3+ ions by the Ho3+ ions is more dominant than transition from the Ho3+ ions. This makes the Ho3+ ions energy levels less populated, resulting in decreased emission intensity [33,34].
In the case of upconversion (excitation at 980 nm), Ho3+ ions cannot directly absorb the incident radiation [39]. However, since these ions are embedded into the Y2O3 host matrix with a phonon frequency of 500 cm−1, the energy difference between incident radiation and the 5I6 level of Ho3+ can be bridged by one or two phonons, which allows the ground-state electrons of Ho3+ to be excited to the 5I6 level and then to higher-lying 5S2 and 5F4 levels (via energy reabsorption through the excited state absorption (ESA) process) [37].
On the other hand, Yb3+ ions can directly absorb 980-nm radiation by undergoing a 2F7/2 (ground state) → 2F5/2 transition. Subsequent relaxation to the ground state results in a release in energy and induces transitions to the 5I5 and 5I6 levels (via ESA) as well as to the 5S2 and 5F4 levels (via GSA) of Ho3+ [36]. As shown in Fig 2(b), an XRD peak shift can be observed with increased Yb3+ doping concentration. The lattice distortion caused by the difference in the ionic radii of Y3+ ad Yb3+ decreases lattice constants and cell volumes, leading to slight structure distortion and decreasing distances between the Yb3+ and Ho3+ ions. As a consequence, this makes it easier to transfer energy among ions, increasing the intensity of emission under 980 nm excitation. Yb3+ ions can also receive energy via inverse energy transfer, which can be explained with the same theory [37-39]. Consequently, the intensity of green photoluminescence increases with increasing Yb3+ content as shown in Fig 8.
4. CONCLUSION
Highly transparent Y2O3:Ho3+,Yb3+ ceramics were prepared by SPS (30 MPa, 15 min) using La2O3 as a sintering aid. All specimens showed high transparency in both the near-infrared and visible-light regions, and sample microstructure was almost unaffected by the amount of doped Yb3+. In the downconversion, strong green photoluminescence (540 and 555 nm) and weak red photoluminescence (615 nm) were observed, and photoluminescence intensity decreased in all regions with increasing Yb3+ content. In the case of upconversion, strong green photoluminescence (545 nm) and weak red photoluminescence (655 nm) were observed. Upon the introduction of Yb3+, photoluminescence intensity greatly increased in every region, with the highest increase observed for 2 mol% Yb3+.