1. Introduction
Tetrahedrite (Cu12Sb4S13) is a promising thermoelectric material composed of abundant elements and has a low thermal conductivity because of its complex crystal structure (space 14 ¯ Cu 2 2 + Cu 10 + Sb 4 3 + S 12 2 - S 2 -
ZT is influenced by the Seebeck coefficient (α), electrical conductivity (σ), thermal conductivity (κ), and temperature (T) in Kelvin, represented as ZT = α2σκ-1T. The Seebeck coefficient and electrical conductivity have a trade-off relationship with the power factor (PF = α2σ) because the carrier concentration has the opposite effect on the two parameters [15]. In general, substitutional doping optimizes the carrier concentration, enhancing the PF, or it decreases the thermal conductivity, improving the thermoelectric properties.
Although many doping studies on tetrahedrites have been conducted on Cu sites, few studies have been performed on Sb sites. Bouyrie et al. [12] reported a ZT of 0.80 at 623 K for Cu12Sb3.39Te0.61S13, and Lu et al. [16] obtained a ZT of 0.92 at 723 K for Cu12Sb3TeS13. Kwak et al. [17] reported a ZT of 0.88 at 723 K for Cu12Sb3.9Bi0.1S13, and Kumar et al. [18] achieved a ZT of 0.84 at 673 K for Cu12Sb3.8Bi0.2S13. In this study, tetrahedrites Cu12Sb4-ySnyS13 (y = 0.1-0.4) partially substituted with Sn at the Sb site were synthesized by mechanical alloying, and sintered by hot pressing, and their charge transport and thermoelectric properties were assessed.
2. Experimental Procedure
Sn-doped tetrahedrites Cu12Sb4-ySnyS13 (y = 0.1, 0.2, 0.3, and 0.4) were synthesized by mechanical alloying. Cu (< 45 μm, purity 99.9%, Kojundo Chemical Lab.), Sb (< 150 μm, purity 99.999%, Kojundo Chemical Lab.), Sn (< 35 μm, purity 99.999%, Kojundo Chemical Lab.), and S (< 75 μm, purity 99.99%, Kojundo Chemical Lab.) were weighed to obtain the corresponding stoichiometric compositions. Mechanical alloying was performed at a rotation speed of 350 rpm for 24 h using a planetary ball mill (Fritsch Pulverisette5) in an Ar atmosphere with stainless-steel jars and balls. The synthesized powder was loaded into a graphite mold and subjected to consolidation using hot pressing at 723 K for 2 h under 70 MPa in vacuum. Details of the process conditions have been reported in a previous study [19].
The phases of the synthetic powder and sintered specimens were analyzed using X-ray diffraction (XRD; Bruker D8-Advance) with Cu-Kα radiation. The diffraction patterns were measured in the θ–2θ mode (2θ = 10–90°) with a step size of 0.02°. The lattice constants were analyzed using the Rietveld refinement (TOPAS program). Scanning electron microscopy (SEM; FEI Quanta400) was used to observe the fractured surfaces of the sintered specimens. The composition was analyzed using an energy-dispersive spectrometer (EDS; Bruker Quantax200), where the energy levels of the elements were adopted as Cu-Lα (0.928 eV), Sb-Lα (3.604 eV), Sn-Lα (3.444 eV), and S-Kα (2.309 eV). The Hall coefficient, carrier concentration, and mobility were measured by the van der Pauw (Keithley 7065) method by applying a constant magnetic field of 1 T and a current of 100 mA. The Seebeck coefficient and electrical conductivity were measured using a ZEM-3 (Ulvac-Riko) system in a He atmosphere. The thermal diffusivity and specific heat were measured using the laser flash method with TC-9000H (Ulvac-Riko) equipment, and then the thermal conductivity was estimated. Finally, the PF and ZT were evaluated at temperatures in the range of 323-723 K.
3. Results and Discussion
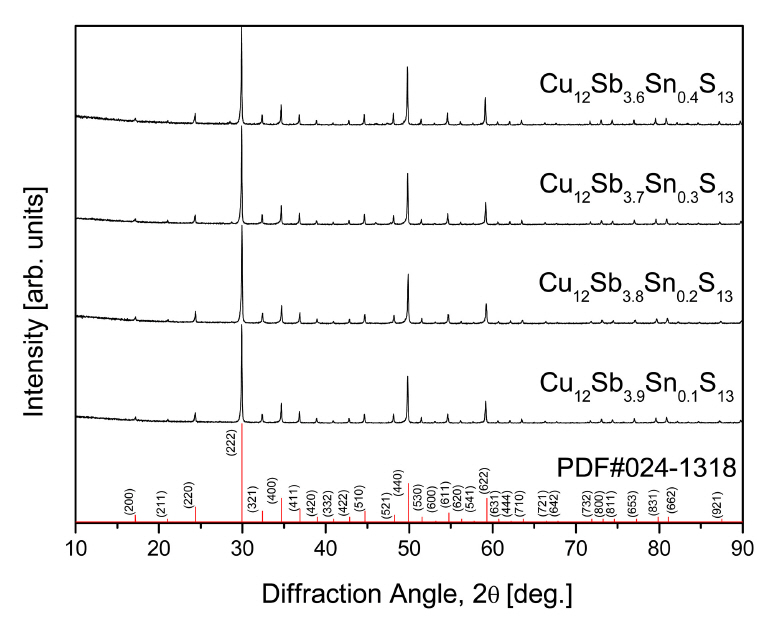
Figure 1 shows the XRD analytical results for the Cu12Sb4-ySnyS13 prepared by mechanical alloying and hot pressing. A single tetrahedrite phase (ICDD PDF#024-1318) was identified without secondary phases, and no phase transitions were observed at the doping content range in this study. As Table 1 shows, the lattice constant of Cu12Sb4-ySnyS13 increased from 1.0348 to 1.0364 nm as the Sn content increased. In our previous study [7], the lattice constant of undoped tetrahedrite Cu12Sb4S13 was 1.0327 nm. Thus, the lattice constant was significantly increased by Sn substitution at the Sb site. Tippireddy et al. [20] reported the ionic radii of Cu+ (60 pm), Cu2+ (57 pm), Sb3+ (76 pm), Sn4+ (69 pm), and Cu2+ (118 pm). Hansen et al. [21] suggested that Sn4+ can be doped into the Cu sites when no other divalent transition elements are present in the tetrahedrite system, suggesting that Cu2+ can be substituted at the Sb3+ site, and Sn4+ can be substituted for Cu+ and/or Cu2+. Therefore, in this study, as the Sn content increased, the lattice constant increased.
Figure 2 shows SEM images of the fractured surfaces of Cu12Sb4-ySnyS13. No remarkable difference in microstructure was observed based on Sn content, and each element was homogeneously distributed, as confirmed by EDS elemental mapping. As Table 1 shows, all the specimens reached relatively high densities of 99.5%-100.0%, and the actual composition was similar to its nominal composition within the error ranges of the EDS analysis. Therefore, in this study, mechanical alloying and hot pressing resulted in the successful preparation of homogeneous and dense Sn-doped tetrahedrite compounds.
Figure 3 shows the carrier concentration and mobility of the Cu12Sb4-ySnyS13. As the Sn content increased, the carrier concentration decreased from 1.28 × 10¹⁹ to 1.57 × 1018 cm-3. Sn4+ substituted at the Sb3+ site provided excess electrons, which reduced the carrier (hole) concentration due to charge compensation. Considering the ionic radii claimed by Tippireddy et al. [20] when Sn is doped in the tetrahedrite, either Sn4+ should be substituted at the Cu+ or Cu2+ site or Cu2+ at the Sb3+ site to increase the lattice constant, as shown in this study. However, if the entirety of the doped Sn is substituted at the Sb3+ site into a Cu2+ state, we should observe a reduction in carrier (hole) concentration. Therefore, this study interpreted that Sn4+ was partially substituted at the Cu+/Cu2+ sites and/or Sn4+ was also partially substituted at the Sb3+ site. This contributed to an increase in the lattice constant and a decrease in the carrier concentration. When y ≤ 0.3, the mobility slightly increased with increasing Sn content but decreased when y = 0.4. The reason the mobility of Cu12Sb3.6Sn0.4S13 decreased is uncertain, but it was assumed to be because of the change in the conduction mechanism.
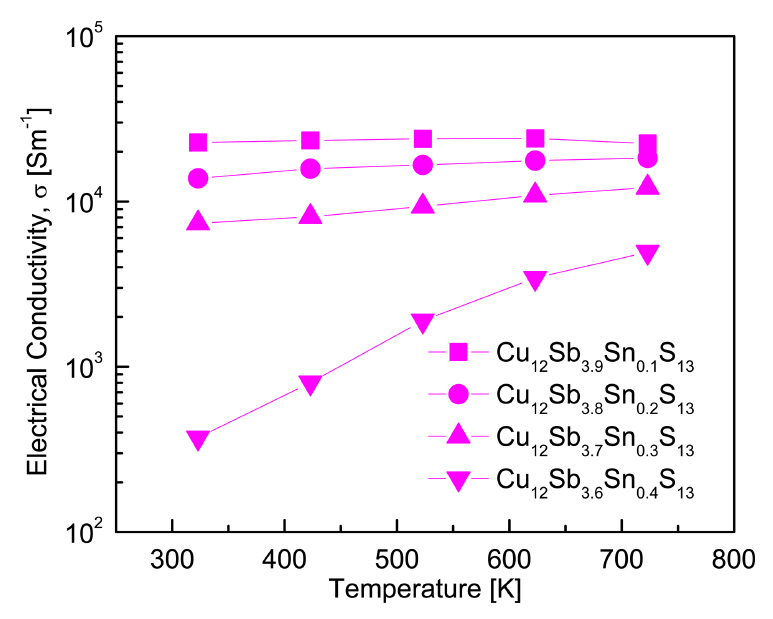
The electrical conductivities of the Cu12Sb4-ySnyS13 samples are shown in Fig 4. The electrical conductivities (σ) of semiconductors are typically affected by the carrier concentration (n) and mobility (μ), which is represented as σ = neμ (e: electronic charge) [22]. For y = 0.1, the specimen in our study exhibited minimal temperature dependence up to 623 K but showed a slight decrease at temperatures above 623 K, indicating degenerate semiconductor behavior. For y = 0.2-0.3, the electrical conductivity slightly increased with increasing temperature. However, in the case of y = 0.4, the electrical conductivity showed a strong positive temperature dependence, indicating non-degenerate semiconductor behavior. Thus, it was determined that the electronic conduction mechanism transitioned from a degenerate to a non-degenerate state when the tetrahedrite was doped with Sn. At a constant temperature, the electrical conductivity decreased as the Sn content increased. This is in good agreement with the decrease in the carrier concentration as the Sn doping level increased, as shown in Fig 3.
Cu12Sb3.9Sn0.1S13 exhibited the highest electrical conductivity of (2.24-2.40) × 104 Sm-1 at temperatures between 323-723 K. For the electrical conductivity of undoped Cu12Sb4S13, Kim et al. [19] reported (2.17-3.03) × 104 Sm-1 at 323-723 K, and Pi et al. [23] obtained (1.10-1.90) × 104 Sm-1 at 323-723 K. Kwak et al. [17] reported that the electrical conductivity increased with increasing Bi content and positive temperature dependence in the cases of y ≤ 0.3 for Cu12Sb4-yBiyS13 (y = 0.1-0.4): as a result, from (2.20-3.12) × 104 Sm-1 at 323 K to (2.95-3.25) × 104 Sm-1 at 723 K. However, when y = 0.4, the electrical conductivity decreased because of the formation of a secondary phase (skinnerite Cu3SbS3). Conversely, Bouyrie et al. [12] reported negative temperature dependence of the electrical conductivity for Cu12Sb4-xTexS13 (x = 0.5-2.0): from (9.09-0.36) × 104 Sm-1 at 300 K to (4.54-0.42) × 104 Sm-1 at 700 K. Tippireddy et al. [20] reported that the electrical conductivity decreased with increasing Sn content and there was a negative temperature dependence for Cu12Sb4-xSnxS13 (x = 0.25-1): from (5.46-3.95) × 104 Sm-1 at 373 K to (4.80-3.09) × 104 Sm-1 at 673 K.
Figure 5 shows the Seebeck coefficients of the Cu12Sb4-ySnyS13 samples. The Seebeck coefficient values of all specimens were positive, indicating that the major carriers were holes of p-type semiconductors. The Seebeck coefficient of a ptype semiconductor is expressed as α = (8/3) π2 kB2m*Te-1h-2 (π/3n)2/3, where kB is the Boltzmann constant, m* is the effective carrier mass, and h is the Planck constant [24]. In our study, as the temperature increased, the Seebeck coefficient increased when y ≤ 0.3, but when y = 0.4, the Seebeck coefficient decreased. In general, when the temperature was higher than a certain temperature (i.e., intrinsic transition temperature), the carrier concentration increased rapidly, and the Seebeck coefficient decreased. This was related to the temperature dependence of the electrical conductivity, as shown in Fig 4.
Accordingly, the intrinsic transition seemed to occur at temperatures below 323 K for Cu12Sb3.6Sn0.4S13. At a constant temperature, the Seebeck coefficient increased as the Sn content increased. Thus, Cu12Sb3.6Sn0.4S13 exhibited a maximum Seebeck coefficient of 270-238 μVK-1 at temperatures of 323-723 K. In the case of undoped Cu12Sb4S13, Kim et al. [19] reported a Seebeck coefficient of 134-183 μVK-1 at 323-723 K, and Pi et al. [23] obtained 155-195 μVK-1 at 323-723 K. Kwak et al. [17] reported that the Seebeck coefficient decreased as the Bi content increased for Cu12Sb4-yBiyS13 (y = 0.1-0.4), and obtained the highest Seebeck coefficient of 153-186 μVK-1 at 323-723 K for Cu12Sb3.9Bi0.1S13. However, Bouyrie et al. [12] found that the Seebeck coefficient increased with increasing Te content for Cu12Sb4-xTexS13 (y = 0.50-1.75). Thus, the highest Seebeck coefficient of 192-264 μVK-1 was obtained at 300-700 K for Cu12Sb2.25Te1.75S13. Tippireddy et al. [20] reported that the Seebeck coefficient decreased with increasing Sn content for Cu12Sb4-xSnxS13 (x = 0.25-1), reaching a maximum value of 183 μVK-1 at 673 K for Cu12Sb3.65Sn0.35S13.
Figure 6 presents the PF of Cu12Sb4-ySnyS13. Based on the temperature dependences of the electrical conductivity and Seebeck coefficient shown in Figs 4 and Fig 5, respectively, the PF increased with increasing temperature. Because both the Seebeck coefficient and electrical conductivity are affected by the carrier concentration, as the Sn content increased, the carrier concentration (i.e., electrical conductivity) decreased, which decreased the PF. In this study, a maximum PF of 0.38-0.73 mWm-1K-2 was obtained at 323-723 K for Cu12Sb3.9Sn0.1S13. For undoped Cu12Sb4S13, Kim et al. [19] and Pi et al. [23] reported 0.40-0.95 mWm-1K-2 and 0.26-0.72 mWm-1K-2 at 323-723 K, respectively. Kwak et al. [17] obtained a high PF of 1.02 mWm-1K-2 at 723 K for Cu12Sb3.9Bi0.1S13, and Bouyrie et al. [12] reported 0.95 mWm-1K-2 at 700 K for Cu12Sb3.5Te0.5S13. Tippireddy et al. [20] achieved a very high PF of 1.30 mWm-1K-2 at 673 K for Cu12Sb3.65Sn0.35S13, which was anomalously higher than in other studies on tetrahedrite at all temperatures examined.
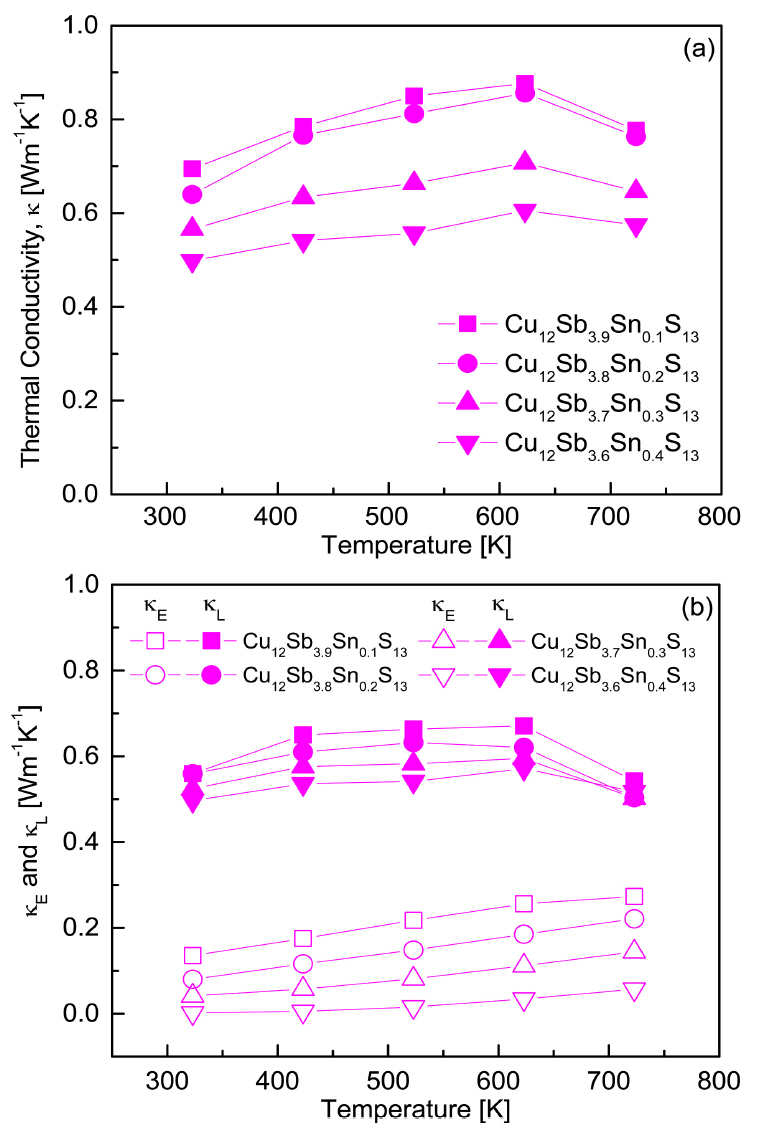
Figure 7 shows the thermal conductivities of the Cu12Sb4-ySnyS13 samples. From the relationship κ = κE + κL, the lattice thermal conductivity (κL) was obtained by subtracting the electronic thermal conductivity (κE) from the total thermal conductivity (κ). The electronic thermal conductivity was calculated using the Wiedemann–Franz law (κE = LσT, L: Lorenz number) [25], where the Lorenz number was estimated using the formula L[10-8V2K–2]= 1.5+exp(–|α|/116) [26,27]. Figure 7(a) shows the total thermal conductivity of Cu12Sb4-ySnyS13. As the temperature increased, the total thermal conductivity increased and then decreased at temperatures above 623 K due to the influence of the lattice thermal conductivity. At a constant temperature, the thermal conductivity decreased as the Sn content increased. Cu12Sb3.6Sn0.4S13 exhibited the lowest thermal conductivity of 0.49-0.60 mWm-1K-1 at 323-723 K, which was lower than the 0.72-0.82 mWm-1K-1 and 0.65-0.78 mWm-1K-1 of undoped Cu12Sb4S13 as reported by Kim et al. [19] and Pi et al. [23], respectively. Kwak et al. [17] obtained a minimal thermal conductivity of 0.77-0.75 mWm-1K-1 at 323-723 K for Cu12 Sb3.6Bi0.4S13. Tippireddy et al. [20] reported a minimum thermal conductivity of 0.61-0.79 mWm-1K-1 at 373-673 K for Cu12Sb3.75Sn0.25S13 and suggested that localized energy caused by lone-pair electrons on Sb scattered the high-velocity acoustic phonons and hybridized with the acoustic dispersions, leading to a reduction in thermal conductivity. Therefore, this study confirmed that the thermal conductivity decreased when Sn was substituted for Sb.
As Fig 7(b) shows, the electronic thermal conductivity increased with increasing temperature but decreased with increasing Sn content, resulting in a minimum electronic thermal conductivity of 0.002-0.057 mWm-1K-1 at 323-723 K for Cu12Sb3.6Sn0.4S13. This was much lower than in other studies: 0.19-0.34 mWm-1K-1 at 323-723 K for Cu12Sb4S13 [19], 0.19-0.40 mWm-1K-1 at 323-723 K for Cu12Sb3.6Bi0.4S13 [17], and 0.27-0.34 mWm-1K-1 at 373-673 K for Cu12Sb3SnS13 [20]. In this study, the lattice thermal conductivity decreased as the Sn content increased, resulting in a minimum lattice thermal conductivity of 0.49-0.57 mWm-1K-1 at 323-723 K for Cu12Sb3.6Sn0.4S13. Kim et al. [19] reported a lattice thermal conductivity of 0.43-0.59 mWm-1K-1 at 323-723 K for Cu12Sb4S13. Kwak et al. [17] obtained a minimum lattice thermal conductivity of 0.58-0.35 mWm-1K-1 at 323-723 K for Cu12Sb3.6Bi0.4S13, and Tippireddy et al. [20] achieved the lowest lattice thermal conductivity of 0.23-0.32 mWm-1K-1 at 373-673 K for Cu12Sb3.75Sn0.25S13.
Figure 8 shows the Lorenz numbers of Cu12Sb4-ySnyS13. Generally, the Lorenz number falls in the range of (1.45-2.44) × 10-8 V2K-2 [28]. Higher and lower Lorenz numbers indicate degenerate semiconductor or metallic behavior and non-degenerate semiconductor behavior, respectively. In this study, the Lorenz number decreased with increasing Sn content, which was considered to be a transition from degenerate to non-degenerate states. Cu12Sb3.9Sn0.1S13 showed the highest Lorenz number of (1.82-1.71) × 10-8 V2K-2, but Cu12Sb3.6Sn0.4S13 exhibited the lowest Lorenz number of (1.59-1.62) × 10-8 V2K-2 at 323-723 K. Similar Lorenz numbers were reported by Kim et al. [19] and Pi et al. [23], namely, (1.71-1.81) × 10-8 V2K-2 and (1.76-1.69) × 10-8 V2K-2 at 323-723 K for Cu12Sb4S13, respectively, and by Kwak et al. [17], namely, 1.88 × 10⁻⁸ V2K-2 at 323 K for Cu12Sb3.7Bi0.3S13.
The ZT for Cu12Sb4-ySnyS13 is shown in Fig 9. As the temperature increased, the ZT increased as the PF increased. Although the thermal conductivity decreased as the Sn content increased, the decrease in the PF was dominant. Therefore, the increase in Sn doping level could not further improve the ZT.
A maximum ZT of 0.66 was obtained at 723 K for the Cu12Sb3.9Sn0.1S13. The ZT values of the Sb-site-doped tetrahedrites were compared. Bouyrie et al. [12] reported that a ZT of 0.65 at 623 K for Cu12Sb3.5Te0.5S13 was generated by the multi-step annealing and spark-plasma sintering (SPS) process. Kwak et al. [17] obtained a ZT of 0.88 at 723 K for Cu12Sb3.9Bi0.1S13 prepared by mechanical alloying and hot pressing. Tippireddy et al. [20] achieved a ZT of 0.96 at 673 K for Cu12Sb3.65Sn0.35S13 fabricated by the annealing-milling-SPS process.
4. CONCLUSIONS
In this study, Sn-doped tetrahedrites Cu12Sb4-ySnyS13 (0.1 ≤ y ≤ 0.4) were synthesized by mechanical alloying and sintered by hot pressing. A single phase of tetrahedrite was obtained without secondary phases or residual elements without post-annealing treatment. The lattice constant increased as the Sn doping content increased, and Sn was substituted at the Sb site. As the Sn content increased, the carrier concentration decreased due to the charge compensation resulting from the excess supply of electrons. As the Sn content increased, mobility tended to increase when y ≤ 0.3, but decreased rapidly when y = 0.4, which was presumed to be caused by a change in the conduction mechanism, from a degenerate to a non-degenerate state. The electrical conductivity increased as the Sn content decreased, and the temperature dependence was minimal when y = 0.1-0.3. However, the electrical conductivity of the specimen with y = 0.4 increased rapidly as the temperature increased, similar to the behavior of a non-degenerate semiconductor. The Seebeck coefficient increased as the Sn content increased. For y = 0.1-0.3, the Seebeck coefficient increased as the temperature increased, but when y = 0.4, it decreased. This was because the carrier concentration increased rapidly at temperatures above the intrinsic transition temperature. The PF increased as the temperature increased, but it decreased with increasing Sn doping content. The PF was dominated by the influence of electrical conductivity. When the Sn content increased at a constant temperature, both the lattice and electronic thermal conductivities decreased. The Lorenz number decreased as the Sn content increased, changing from a degenerate to a non-degenerate state. The maximum ZT of 0.66 was obtained at 723 K for Cu12Sb3.9Sn0.1S13.


