1. INTRODUCTION
Numerous studies on eco-friendly energy-production technologies have been conducted in various fields [1]. In particular, thermoelectric technology can be used for reversible energy conversion—from heat to electricity based on the Seebeck and Peltier effects, respectively [2,3]. Thermoelectric performance is evaluated using the dimensionless thermoelectric figure of merit, zT = S2σT/κtot, where S, σ, κtot and T are the Seebeck coefficient, electrical conductivity, total thermal conductivity, and absolute temperature, respectively. Generally, κtot is divided = κele and κlatt, where κele and κlatt are electrical and lattice thermal conductivities, respectively. The most important goal of research on thermoelectric materials is to enHance zT. However, κele and σ are closely related to each other according to the Wiedemann-Franz law (κele = L · σ · T, where L is the Lorenz number) [4]; consequently, enHancing zT is challenging. Therefore, zT can be improved by either increasing the power factor (S2σ, PF) or by decreasing κtot. Skutterudites are typical thermoelectric materials with high PF. CoSbCoSb3-based skutterudites have a relatively high κtot of 3W/mK or more and a high PF of approximately 5 mW/mK2 [5]. Skutterudites show excellent thermoelectric performance at high temperatures, but relatively poor performance at low temperatures. Therefore, skutterudites are unsuitable for wearable devices or vehicle applications. The most effective stratEgy for improving zT at low temperatures is to reduce κtot [6,7]. Chalcogenides have a very low κtot owing to their weak van der Waals bonding between atomic layers; thus, they can be potential thermoelectric materials with a high zT even at room temperature [8].
Chalcogenides are being actively studied as modules for various devices such as wearable devices and generators for vehicles [9,10]. Defect engineering, such as doping and nanostructuring, is an effective approach for reducing κlatt by increasing point-defect phonon scattering [11-13]. This stratEgy has been adopted in many studies to enHance zT in chalcogenides [13-17]. Rhyee et al. reported that In4Se2.35 exhibited a very high zT value of 1.48 at 705 K via self-doping by Se deficiency [13]. Qin et al. synthesized Mndoped Bi0.5Sb1.5Te3 and a maximum zT of ~1.3 was achieved for Mn0.0075Bi0.5Sb1.4925Te3 at 430 K [15].
However, the thermoelectric performance of rhenium chalcogenide compounds has not been extensively investigated. According to density functional theory calculations by Hafeez et al. [18], ReS2 and ReSe2 have different band gaps:1.58 eV (1.50 eV) for monolayer (bulk) ReS2 and 1.32 eV (1.26 eV) for monolayer (bulk) ReSe2. Sreeparvathy reported that ReX2 (x = S and Se) has flat bands aligned in both the valence and conduction bands, which contribute to the enhancement of S [19]. Sreeparvathy also showed that ReS2 has the potential to have a large S of 540-600 μV/K at 300 K. Re2Te5, a rhenium chalcogenide, does not have a layered structure but has a complex orthorhombic (space group: Pbca [61]) crystal structure with 84 atoms ([Re24] and [Te60]) per unit cell. These atoms exhibit a cluster-type Chevrel phase, with [Re6] surrounded by [Te8] [20-22].
One of the structural properties of the Chevrel phase is the presence of four large vacancies. This causes scattering of phonons, effectively reducing κlatt. Inevitably, κtot of Re2Te5 is 1.3 W/mK which is as low as that of chalcogenides which have layered structures [21]. Further, Caillat et al. reported that rattling was observed in elements doped into vacancies, resulting in reduced κtot due to increasing phonon scattering [23]. Therefore, the application of defect engineering to Re2Te5 is a reasonable approach for improving thermoelectric performance.
In this study, the thermoelectric transport properties of Se-doped Re2Te5 samples were investigated. We synthesized a series of ReTe5-xSex (x = 0, 0.2, 1, and 2) samples. The electrical and thermal transport properties of the samples were investigated, and Hall measurements were conducted to analyze the electrical transport properties of the samples in detail. The density-of-state effective mass was calculated from the measured parameters. zT was evaluated to determine the optimum composition for Se-doped Re2Te5.
2. EXPERIMENTAL
A series of Re2Te5-xSex (x = 0, 0.2, 1, and 2) samples were stoichiometrically synthesized using a conventional solidstate reaction process. High-purity element Te (99.999%), Se (99.999%), and Re (99.999%) powders were mixed and loaded in a vacuum quartz tube. The loaded vacuum quartz tube was then heated to 950°C for 6 hours and then maintained for 70 hours. After heating, the samples were cooled to room temperature in a furnace. The synthesized Sedoped Re2Te5 samples were pulverized into powder by highenergy ball milling (SPEX 8000D, SPEX). The powder samples were placed in graphite molds and cold-pressed to form the green bodies. The samples were sintered using spark plasma sintering (SPS-1030, Sumitomo Coal Mining Co., Ltd.) under vacuum at 850°C for 10 min under 70 MPa. The crystal structures of the samples and the presence of impurities were identified using X-ray diffraction (XRD, D8 Discover, Bruker) analysis. Furthermore, σ and S were measured simultaneously using a thermoelectric-property measurement system (ZEM-3, Advanced-Riko) in the temperature range of 300-880 K in a He atmosphere. The error margins for σ and S were less than 3% and 5%, respectively.
The Hall carrier concentrations (nH) and Hall carrier mobilities (μH) were measured using a Hall measurement system (HMS5300, Ecopia) under a 0.548 T magnetic field. The κtot value of each sample was calculated using the density (ρs), heat capacity (Cp), and thermal diffusivity (α). ρs was considered to be the theoretical density of orthorhombic Re2Te5 (8.423 g/cm3 [2]). The Cp of each sample was measured by differential scanning calorimetry (DSC8000, Perkin Elmer). The α value of each sample was measured by laser flash analysis (LFA457, Netzsch). The error margin for α was less than 7%. The zT values of the samples were calculated based on measured data.
3. RESULTS AND DISCUSSION
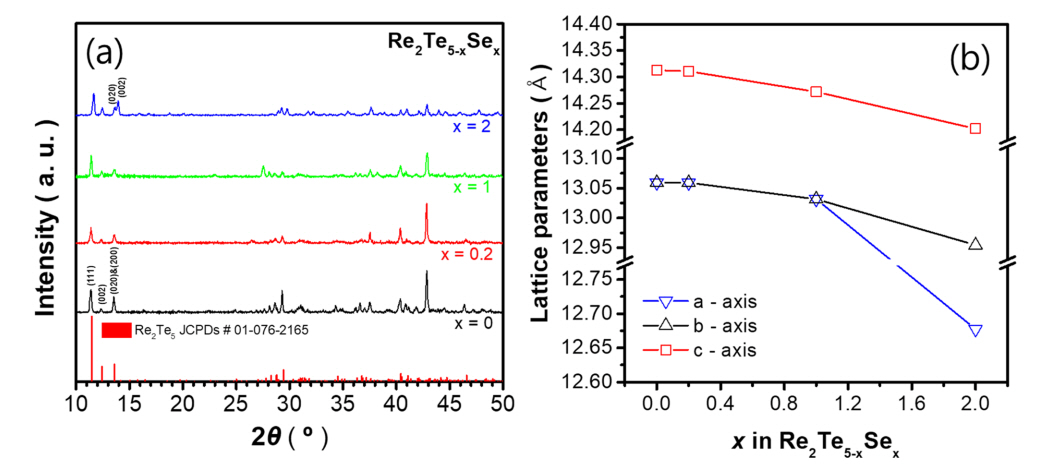
Figures 1(a) and 1(b) show the XRD patterns and calculated lattice parameters of the series of Re2Te5-xSex (x = 0, 0.2, 1, and 2) samples, respectively. As shown in Figure 1(a), single orthorhombic Re2Te5 phases were synthesized without impurities. The (200) and (020) diffraction peaks for the samples with x = 0, 0.2, and 1 appeared as a single peak, and the calculated lattice parameters, a and b of these samples were almost identical. However, for the sample with x = 2, the (200) and (020) peaks were separated. Therefore, the calculated lattice parameters, a and b for x = 2 exhibited significantly different values of 12.68 and 12.95 Å, respectively. The lattice parameters along the three axes gradually decreased with increasing Se doping content, which is attributed to the difference in ionic radii between Se2− (184 pm) and Te2− (207 pm). Therefore, this result confirms that Se atoms were successfully substituted at Te sites.
Figure 2 shows the thermoelectric transport properties measured perpendicular to the pressing axis. As shown in Figure 2(a), σ for the samples with x = 0, 0.2, 1, and 2 were 0.106, 0.112, 0.020, and 0.005 S/cm at 300 K, respectively. All the samples exhibited typical semiconductor behavior, and σincreased to 33.74, 36.71, 3.88, and 2.25 S/cm at 880 K for Re2Te5-xSex with x = 0, 0.2, 1, and 2, respectively. The maximum σ value was observed for Re2Te5-xSex with x = 0.2. Figure 2(b) shows the temperature dependence of S for the samples. At 300 K, the S values were 574, 497, 424, and 299 μV/K for Re2Te5-xSex with x = 0, 0.2, 1, and 2, respectively; at 300 K S decreased gradually with increasing x.
Generally, the magnitude of S increases when σ decreases because of the trade-off relationship between S and σ. However, the S of the samples with x = 1 and 2 at 300 K decreased despite the decrease in σ of these samples. This result can be explained by the bipolar effect. The samples with x = 1 and 2 initially increased with T and then decreased following their maximum values at approximately 580 K, suggesting that bipolar excitation dominates the transport [25]. Therefore, the relationship between the measured S completely reversed at 880 K; the values of S were 190, 192, 245, and 286 for x = 0, 0.2, 1, and 2, respectively at 880 K.
The PF values of the samples calculated from the measured σ and S values are shown in Figure 2(c). The PF values of the samples with x = 0 and 0.2 are very similar up to 670 K, but at T > 670 K, the PF value of the sample with x = 0.2 is higher than that of the sample with x = 0. Therefore, a maximum PF of 0.135 mW/mK2 was achieved for x = 0.2 at 880 K. However, the samples with x = 1 and 2 exhibited very low PF values of 0.023 and 0.019 mW/mK2 at 880 K, respectively. The decrease in PF for these samples is attributed to the reduction in σ and the small increase in S due to the amplified bipolar effect.
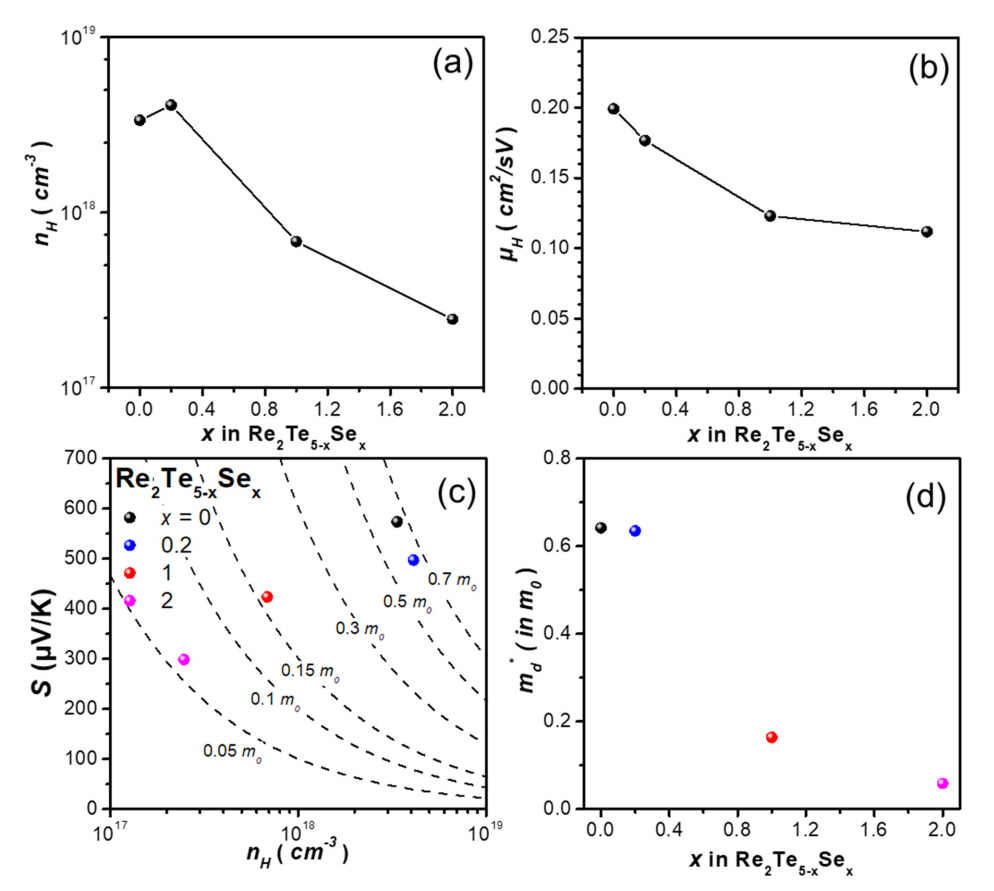
Figures 3(a) and 3(b) show the measured electrical transport properties of the samples at 300 K. The nH value marginally increased from 3.37 × 1018 cm-3 to 4.11 × 1018 cm-3 when a small amount of Se (~0.03 at. %) was doped to pristine Re2Te5 sample. However, nH decreased with a further increase in Se content. The μH values of the samples measured at 300 K were 0.20, 0.18, 0.12, and 0.11 cm2/Vs for x = 0, 0.2, 1, and 2, respectively. The μH values decreased gradually as the Se content increased. The increase in σ for x = 0.2 and the decrease in σ for x = 1 and 2, were due to the improved nH for the sample with x = 0.2, and the reduced nH and μH for the samples with x = 1 and 2.
S as a function of nH at 300 K is plotted for the series of samples (Pisarenko plot) in Figure 3(c). The dotted lines in Figure 3(c) indicate the contours of the density-of-state effective mass (md*, expressed with respect to the free electron mass, m0) according to the Mott relationship [26].
where h, e, and k are the Planck’s constant, elementary charge, and Boltzmann constant, respectively. Figure 3(d) shows the change in md* of the Re2Te5-xSex (x = 0, 0.2, 1, and 2) samples with respect to x. As the Se content increased, the md* value gradually decreased. The md* values of the samples were 0.64, 0.63, 0.16, and 0.06 m0 for the samples with x = 0, 0.2, 1, and 2, respectively.
Figure 4(a) shows the plot of κtot vs temperature for the Re2Te5-xSex (x = 0, 0.2, 1, and 2) samples. The measured κtot value of the undoped sample gradually decreased with T from 1.33 to 0.59 W/mK up to 740 K, but then increased to 0.66 W/mK at 880 K. The κtot values of the doped samples were significantly low (below ~0.85 W/mK), and notably, the samples with x = 1 and 2 exhibited very low κtot values of 0.23-0.53 W/mK. Figure 4(b) shows the temperature dependence of κele of the samples, and the κele values exhibited a trend similar to that of the σ values. However, the influence of κele on κtot was marginal, because the measured σ was less than 50 S/cm. Consequently, the κlatt values were almost identical to the κtot values, as shown in Figure 4(c). Further, κlatt gradually decreased with increasing Se content over the entire temperature range; this was attributed to the point defect phonon scattering by Se doping.
The gradual decrease in lattice parameters a, b, and c suggests an increase in lattice distortion, which leads to a decrease in κlatt. Furthermore, the scattering parameters are proportional to the difference in mass (ΔM) in the pointdefect scattering mechanism [27]. Therefore, the difference between the atomic masses of Te (127.6 u) and Se (79.0 u) also contributed to the decrease in κlatt.
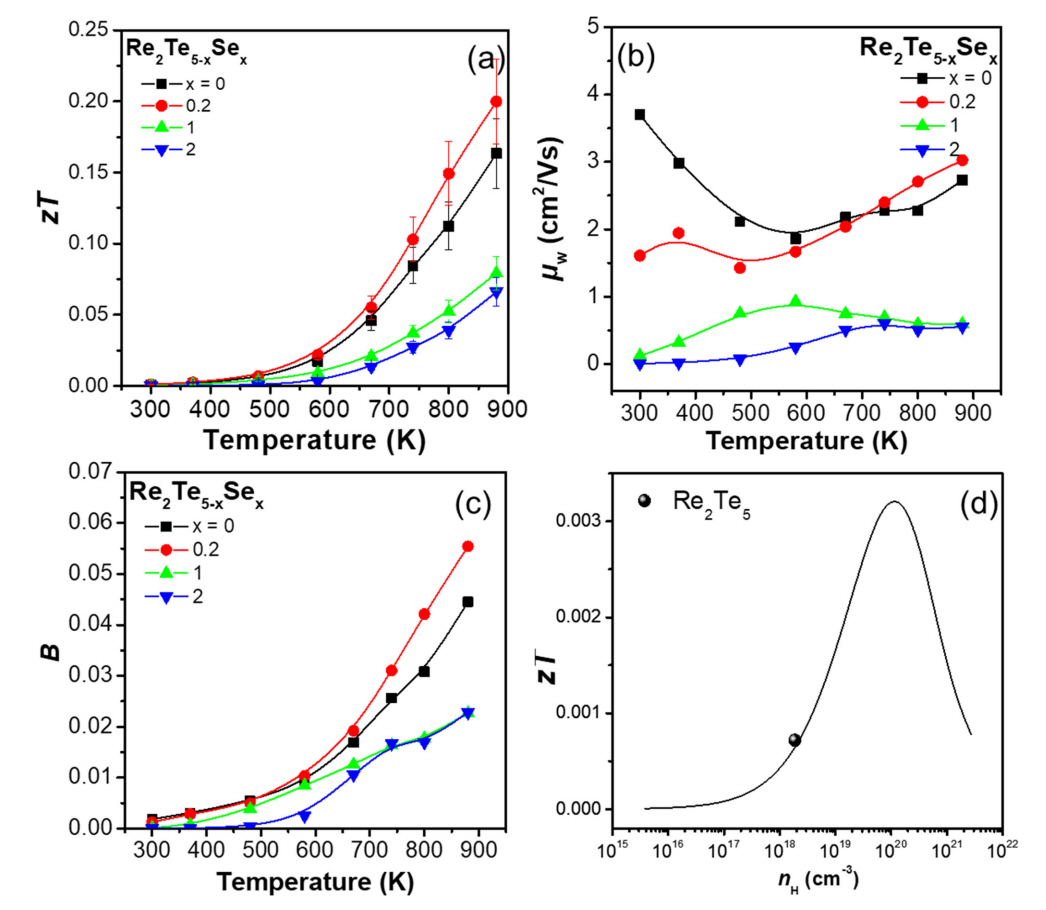
Next, the zT values were calculated using the measured σ, S, and κtot values of the samples (Figure 5(a)). The error margin for zT was less than 15%. The highest zT value of 0.20 was achieved for the sample with x = 0.2 at 880 K, which is ~22% higher than that of the pristine Re2Te5 sample. The zT enhancement for x = 0.2 was attributed to the marginal increase in PF and decrease in κtot. However, the other doped samples (x = 1 and 2) exhibited reduced zT values because of the significant decrease in PF, despite the very low κtot values.
Figure 5(b) shows the weighted mobility (μw) as a function of the temperature for the samples. μw is proportional to the maximum PF that a sample can reach when nH is optimized. The μw value of each sample was calculated from the measured σ and S; μw can be obtained from a simple analytical form that approximates the exact Drude-Sommerfeld free-electron model given in Equation (2) for |S| > 20 μV/K [28].
where me is the mass of the electron. The calculated μw values at 880 K were 2.73, 3.03, 0.59, and 0.56 cm2/Vs for x = 0, 0.2, 1, and 2, respectively. The μw values increased at x = 0.2, and then decreased with increasing x, which is in agreement with the PF trend at 880 K. Therefore, the PF of the sample with x = 0.2 can be further improved by appropriate nH tuning. In addition, μw is closely related to md* as shown in Equation (3) [29].
where μ0 is the non-dEgenerate mobility. The μw values of the samples at 300 K were 3.70, 1.61, 0.12, and 0.08 cm2/Vs for x = 0, 0.2, 1, and 2, respectively. The μw values at 300 K decreased with x, which can also be observed in the md* trend.
Figure 5(c) shows the dimensionless thermoelectric quality factor (B) of each sample, calculated from μw and κlatt. B was calculated using Equation (4) [28]:
B is related to the maximum zT that a material can achieve when nH is optimized. The general trend of B closely followed that of zT: B increased at x = 0.2, and decreased with a further increase in Se content. Figure 5(d) shows the plot of the expected zT of pristine Re2Te5 as a function of nH at 300 K using a single parabolic band model. The parabolic line in Figure 5(d) was calculated using Equation (5) [29].
(5)
where Fxη (η is the reduced electrochemical potential) and τac are the Fermi intEgral and relaxation time of acoustic phonon scattering, respectively.
Therefore, maximum zT can be achieved when nH is ~1020cm-3. Accordingly, the zT of Re2Te5 can be substantially enHanced by appropriate cation doping, such as Zr4+, Sn4+ and Hf4+, in Re5+-site, considering the significant decrease in κtot due to Se doping.
4. CONCLUSIONS
A series of Re2Te5-xSex (x = 0, 0.2, 1, and 2) polycrystalline samples were prepared to investigate their electrical and thermal transport properties. Pure orthorhombic Re2Te5 phases were synthesized without any impurities, and the lattice parameters a, b, and c gradually decreased with increasing Se content, confirming the substitution of Se atoms at the Te sites. A maximum power factor of 0.135 mW/mK2 was obtained for the sample with x = 0.2 at 880 K, predominantly due to the increase in the nH and σ. The lattice thermal conductivity significantly decreased with increasing Se content, which was attributed to the point defect phonon scattering by Se doping. Further, zT reached a maximum value of 0.20 at 880 K for the Re2Te4.8Se0.2 (x = 0.2) sample, an enhancement of approximately 22% compared to the pristine Re2Te5 sample. The single parabolic band model predicted that zT can be further improved by appropriate nH tuning.


