Hydrogenation Properties of MgH2-CaO Composites Synthesized by Hydrogen-Induced Mechanical Alloying
Article information
Abstract
Although magnesium-based alloys are attractive materials for hydrogen storage applications, their activation properties, hydrogenation/dehydrogenation kinetics, thermodynamic equilibrium parameters, and degradation characteristics must be improved for practical applications. Further, magnesium poses several risks, including explosion hazard, environmental pollution, insufficient formability, and industrial damage. To overcome these problems, CaO-added Mg alloys, also called Eco-Mg (environment-conscious Mg) alloys, have been developed. In this study, Eco-MgHx composites were fabricated from Mg–CaO chips by hydrogeninduced mechanical alloying in a high-pressure atmosphere. The balls-to-chips mass ratio (BCR) was varied between a low and high value. The particles obtained were characterized by X-ray diffraction (XRD), and the absorbed hydrogen was quantified by thermogravimetric analysis. The XRD results revealed that the MgH2 peaks broadened for the high BCR. Further, PSA results revealed particles size were decreased from 52 μm to 15 μm.
1. INTRODUCTION
Hydrogen could replace coal and petroleum as the predominant energy source in the near future, but several challenges, including cost, efficiency, and stability [2], must be resolved for this to become a reality. As a candidate material for hydrogen storage, MgH2 is considered attractive because of its high hydrogen storage capacity (7.66 wt%) and low cost [3]. In the past decade, several research groups have successfully demonstrated the positive effects of additives and their strong effects on the hydrogen sorption kinetics of MgH2 [4]. The most common additives are based on transition metals (e.g., Fe, Nb, Ni, Ti, V, Ce, and Co), their oxides (e.g., Nb2O5 and Fe2O3), and fluorides (e.g., FeF3, TiF3, NiF2, and NbF5) [5-14]. However, MgH2 is thermodynamically highly stable and its H-sorption kinetics are poor, which require operational temperatures above 573 K, which is not very feasible [3]. At the same time, Mg alloys are easily oxidized and burned when they are exposed to high temperature or fire [15-17]. Various ignition tests to evaluate the safety of Mg alloys have been developed to investigate the ignition resistance of Mg alloys. CaO added Mg alloys have been developed as fire-retardant solutions for Mg products in various applications, to preventing poisonous gas generation, inhalation burns, and ignition generation. CaO added Mg alloys are cost effective because of the low cost of CaO and, furthermore CaO addition can be applied to cast Mg alloys such as AM60, AZ91D etc. without changing the alloys’ original process-ability, including fluidity, hot tearing susceptibility, and die soldering tendency [18-21]. CaO-added Mg alloys are also called Eco-Mg (environmentconscious Mg) alloys. They work by eliminating SF6, which is a global warming gas, by reducing other protective gases, such as NOVECTM612 and HFC-134a; and by eliminating Be [1]. This paper investigated the effect of nanocrystals on the absorption properties of Magnesium hydride and evaluated the TGA weight change and DSC of Eco-Mg at different temperatures. The kinetics were evaluated by Sievert’s type testing. Efforts were made to improve hydrogenation properties by mechanical alloying(MA) in accordance with previous studies.
2. EXPERIMENTAL
An Mg (3N) ingot was made into chips by using a drilling machine [22]. Fine-grained MgHx powders were then produced after alloying for 24, 48, 72, and 96 h at a pressure of 3 MPa in a hydrogen atmosphere using a planetary ball mill (Fritsch, Pulverisette 5). The ball-to-chip ratio (BCR) was set at 30:1 or 66:1, while the rotation speed was set at 200 rpm.
The crystal structure of the milled alloys was characterized by X-ray diffractometry (XRD, RINT-2000, Rigaku) using CuKα for sample irradiation. The scanning rate was set at 3°/min over a scanning angle (2θ) range of 20° to 80°. The surface morphologies, particle sizes, and component distributions of the synthesized samples were observed using an emission scanning electron microscope (E-SEM). Through thermogravimetric/differential scanning calorimetric (TG/DSC) analysis, the threshold temperature for dehydriding, phase change temperature, and activation energies of the samples were calculated. The TG/DSC testing was carried out over a temperature range from room temperature to 823 K. An inert atmosphere was maintained in the testing chamber with argon gas (50 mL/min), and the heating rate was 10 K/min.
Regarding the hydrogenation attributes, the kinetics of hydrogen absorption were analyzed using an automated pressure-composite-temperature apparatus (PCT; Sievert’s type). Temperatures of 473, 523, 573, and 623 K were applied during the testing process, and the synthesized specimens were observed for one hour under hydrogen pressure of 3 MPa.
3. RESULTS AND DISCUSSION
Figure 1 shows the typical morphologies of the ball-milled samples. A broad particle size distribution can be observed, and the SEM images suggest that particle aggregation occurs during milling [2]. The ball milling time and BCR have an impact on the particle size. In general, as the milling time and BCR increase, the particle size becomes smaller and more homogeneous. According to Huang et al. [23], there is a correlation between particle size and hydrogen diffusion; an increase in the specific surface area of nanoparticles leads to better hydrogen absorption and desorption.
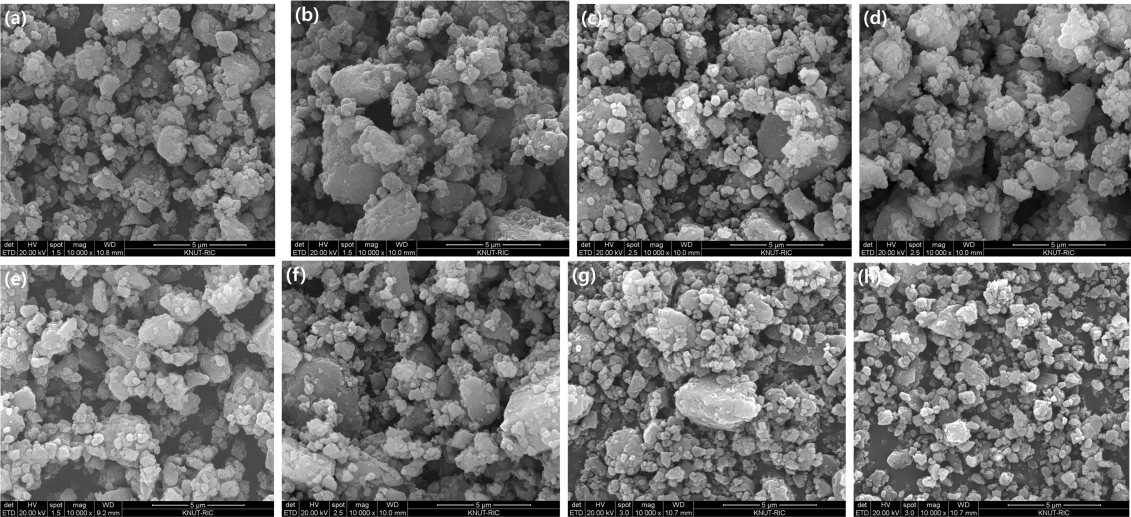
Scanning electron microscope (SEM) images of the MgHx-CaO composites fabricated with BCRs and MAs of (a) 30:1 and 24 h, (b) 66:1 and 24 h, (c) 30:1 and 48 h, (d) 66:1 and 48 h, (e) 30:1 and 72 h, (f) 66:1 and 72 h, (g) 30:1 and 96 h, and (h) 66:1 and 96 h.
Figure 2 shows the XRD analysis results obtained for the MgHx-CaO composites. The intensities of the characteristic peaks of the MgHx-CaO composites decreased, while the width of the main peaks increased with increased milling time at a given BCR. After milling for 72 h, the peak intensity was low, and the peak characteristics of Mg and MgH2 could be observed. This indicates that Mg was not completely hydrogenated in the composite. At 96 h, the MgH2 peak intensity was higher than those for other milling times, and a CaH2 peak appeared. The Mg peak almost disappeared. With all the peaks, a CaO peak almost appeared, but the CaO and Mg peaks are similar. In any case, the XRD peak expressed the same 2-Theta.
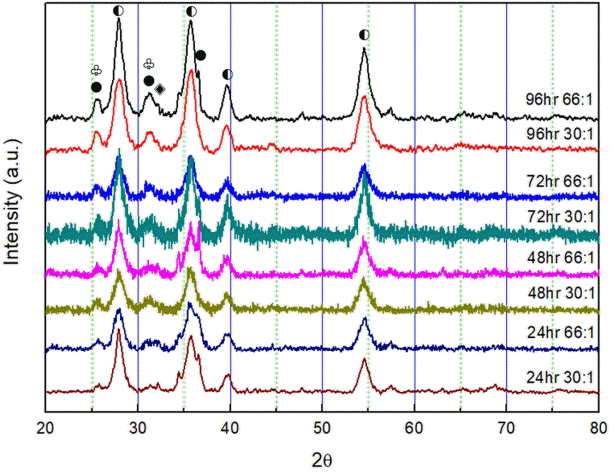
XRD patterns of MgHx-CaO fabricated with various BCRs and milling times: 24 h 30:1, 24 h 66:1, 48 h 30:1, 48 h 66:1, 72 h 30:1, 72 h 66:1, 96 h 30:1, 96 h 66:1 (Mg:●, MgH2:◐, and CaH2:◈ CaO: ♧).
Table 1 lists the specific areas, pore volumes, and pore diameters of the MgHx-CaO composites, as calculated by Brunauer–Emmett–Teller (BET) measurements. At a BCR of 66:1, the specific surface areas of the produced composites were 3.3418 m2/g and 5.0540 m2/g at MA durations of 72 h and 96 h, respectively, but when the BCR was 30:1, the corresponding surface areas increased to 7.1576 m2/g and 8.9642 m2/g, respectively. Pore size was expected to increase due to the MA effect, but high specific surface areas could not be obtained due to particle agglomeration, which is a major disadvantage in the MA processes. The pore sizes of the samples also indicated that they were composed of a dense composite material with nanosized pores.
Table 2 lists the mean particle size of each sample. 66:1 96 h samples exhibited a 15.8259 μm mean particle size. The smallest time and sample with BCR showed a relatively large mean size of 52.2052 μm. In general, small particle size has been reported to help increase adsorption.
Figure 3 shows the TG/DSC analysis results obtained at a heating rate of 10 K/min in an Ar atmosphere at a gas flow rate of 50 mL/min. The mass changes occurring in all the samples were recorded. These mass changes may be attributed to adsorbed hydrogen exiting from the magnesium-based substrate. After that, oxygen in the ambient air oxidizes the sites where hydrogen was removed.
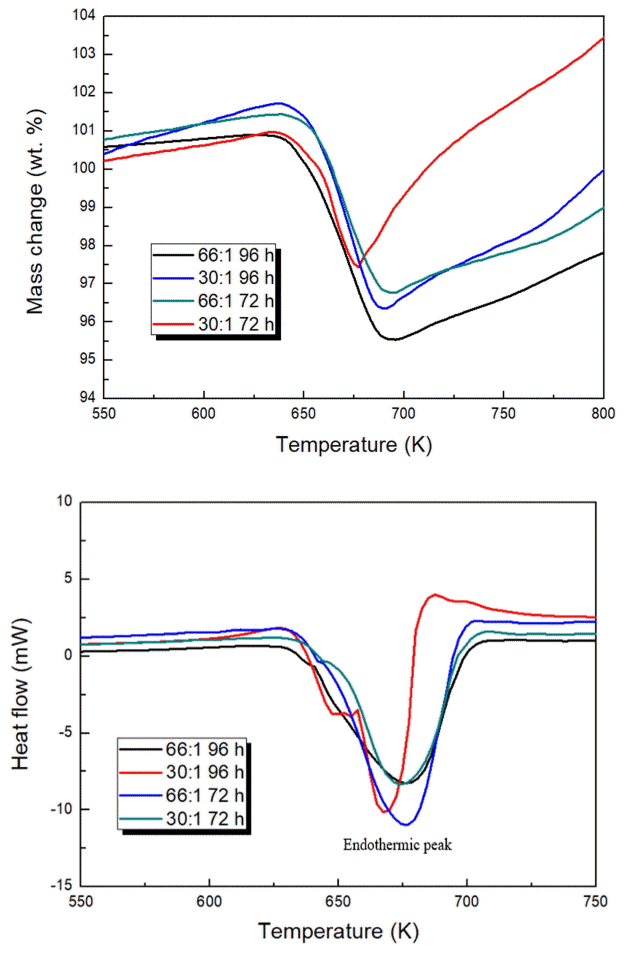
TG/DSC analysis of the MgHx-CaO composites at a heating rate of 10 K/min. (a) TG curves and (b) DSC curves of the MgHx - CaO – 66:1 96 h, MgHx-CaO – 30:1 96 h, MgHx-CaO – 66:1 72 h, and MgHx-CaO – 30:1 72 h composites.
The results of the TGA analysis indicate that dehydrogenation of the composites produced in all samples was initiated at ~630 K. However, differences in the amount of hydrogen adsorption based on the milling time and BCR were confirmed. At sample 66:1 96 h was 5.36 wt%, 30:1 96 h as 5.32 wt%, 66:1 72 h was 4.66 wt%, and 30:1 72 h was 3.53 wt%. Although the hydrogen adsorption temperature could not be lowered by increasing the milling time and BCR, it was expected that the hydrogen adsorption amount would increase with increased specific surface area and particle size.
The DSC results shown in Fig 3(b) are in good agreement with the results of the TG analysis. The reaction enthalpies of the composites were calculated. The ΔH values were found to be –2.2 KJ/mol H2 and –2.7 KJ/mol H2, respectively, after MA for 96 h and 72 h at a BCR of 66:1. Similarly, the reaction enthalpies were –2.2 KJ/mol H2 and –2.0 KJ/mol H2, respectively, after MA for 96 h and 72 h at a BCR of 30:1. The enthalpy is generally expected to decrease due to increased milling time and BCR. A small value of -2.2 KJ/mol H2 was obtained for a sample with 96 h milling. However, the smallest value of -2.0 KJ/mol H2 was obtained at 30:1 72 h, which was expected to be the largest.
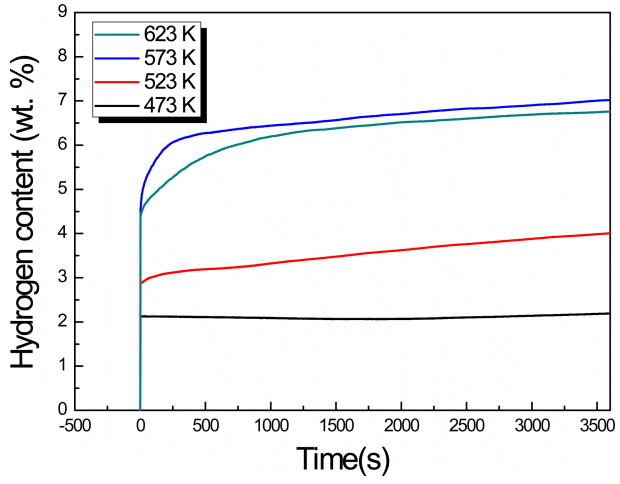
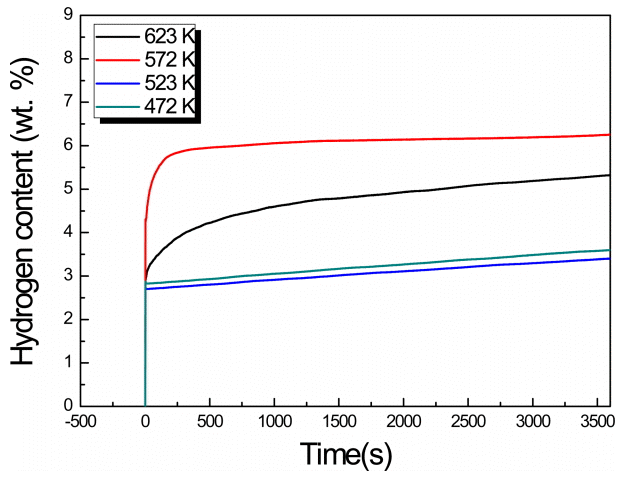
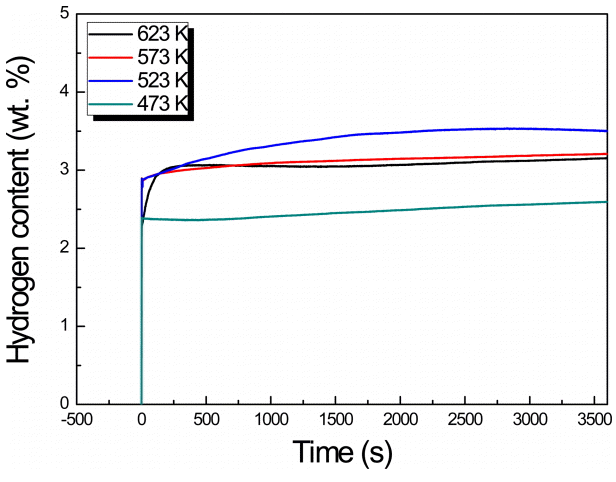
Figure 4–7 show the measured hydrogenation reaction rates of the MgHx-CaO composites. In the region of 573 K, a slowdown appears in the slope, and the largest amount of hydrogen storage occurs. Moreover, in all the systems, except at a BCR of 30:1 and a milling time of 72 h, the largest amount of hydrogen storage was observed at 573 K. At the relatively low temperatures of 473 K and 523 K, the reaction rate was comparatively fast, but the amount of hydrogen stored was only about half of that stored at 673 K. On the other hand, the hydrogenation rate increases at higher temperatures which facilitates faster diffusion of hydrogen atoms. The maximum hydrogen storage capacity (7.019 wt%) was obtained at a BCR of 66:1 with an MA duration of 96 h, and a testing temperature of 673 K. However, from the viewpoint of the rate of the hydrogenation reaction, a BCR of 30:1 and MA time of 96 h were found to be optimal at 673 K.
4. CONCLUSIONS
The following conclusions can be drawn from the analysis of MgHx-CaO composites fabricated by hydrogen-induced mechanical alloying.
1) XRD and SEM analyses confirmed the presence of nano/amorphous phases in the composite materials. It could be inferred that MA led to reduced particle size, which in turn increased the specific surface area, as measured by BET. An increase in the specific surface area is thought to improve the hydrogenation reaction rate by increasing the hydrogen diffusion rate.
2) The TG analysis results confirmed that adsorption temperature could not be lowered by increasing the milling time and BCR, and it was confirmed that enthalpy decreased and hydrogen adsorption increased. This was expected due to the increase in surface area, the increase in pore size, and a decrease in particle size.
3) According to the hydrogen reaction rate measurements, the maximum storage capacity (7.019 wt%) could be achieved at 673 K when the BCR was 66:1 and the MA duration was 96 h. This value is close to that of the maximum capacity previously reported for MgHx (7.6 wt%) [3]. Further, the composites exhibited a high storage capacity (6.761 wt%) even at 623 K. All the samples exhibited the highest hydrogenation reaction rate at a temperature of 673 K; therefore, it is concluded that hydrogen diffusion into MgHx-CaO is maximal at 673 K.
Acknowledgements
This study was supported by a financial grant from the Ministry of Trade program on Industry & Energy, Republic of Korea [Grant Number G02N03620000904].


