A New Fracture Analysis Technique for Charpy Impact Test Using Image Processing
Article information
Abstract
The Charpy impact test is used to identify the transition between ductility and brittleness. The percentages of ductile and brittle fractures in steel can be evaluated based on each fracture area, which is presently determined by an analyzer with the naked eye. This method may lead to subjective judgement, and difficulty accurately quantifying the percentage. To resolve this problem, a new analysis method based on image processing is proposed in this study. A program that can automatically calculate the percentage of the ductile and brittle fractures has been developed. The analysis is performed after converting an RGB fracture image into a binary image using image processing techniques. The final binary image consists of 0 and 1 pixels. The parts with the pixel values of 1 correspond to the brittle fracture areas, and the pixel values of 0 represent the ductile fracture areas. As a result, by counting the number of 0 pixels in the entire area, it is possible to automatically calculate the percentage of ductile fracture. Using the proposed automatic fracture analysis program, it is possible to selectively distinguish only the brittle fracture from the entire fracture area, and to accurately and quantitatively calculate the percentages of ductile and brittle fractures.
1. Introduction
The Charpy impact test, one of the fracture behavior tests, is a method for measuring material properties such as the ductility or toughness of materials. The method measures the amount of energy that the materials absorb before fracture, and is used not only to indicate the toughness of the material but also to identify ductile-brittleness changes according to temperature [1-2]. The percentage of shear area is calculated based on the fracture area which is judged directly by the analyzer with the naked eye. The method is not only susceptible to the subjective judgment of the analyzer, but also has the problem that accurate quantitative analysis is impossible. To overcome these deficiencies, a new method based on image processing is proposed in this work. The fracture analysis method proposed in this study is based on a program that can automatically calculate the percentage of ductile and brittle fractures using an image processing technique. To apply the proposed automatic fracture analysis program, fracture images obtained through an optical microscope should be converted into new images first for a specific purpose. The proposed method can selectively distinguish the brittle fracture area from the entire fracture area and automatically calculate the percentage of ductile and brittle fracture areas quantitatively.
2. Theoretical Background
2.1 Charpy Impact Test
The impact test includes an impact bending test, impact twisting test, impact tension test and impact compression test according to how the external force is applied. The most common test is the impact bending test which usually involves Charpy and Izod impact tests. In the Charpy V-notch impact test, the notched part of a specimen is placed on the center horizontally after fixing it on both hinges of the lower part, and a pendulum is lifted to a constant height and dropped. It determines the lowest height at which the specimen is impacted and broken. This height is measured to calculate the energy absorbed by the specimen.
It is also possible to distinguish between the ductile and brittle fractures using the characteristics of the fracture area of the specimen after the impact test. As a result, the Charpy V-notch impact test can be used to obtain various data, including the absorbed impact energy, percentage of ductile fracture area and material expansion [3-4].
DBTT represents the specific temperature at which materials with ductility characteristics become brittle as temperature decreases. Brittleness is an easily observed phenomenon in metal materials, but the mechanism of this transition has not yet been clarified sufficiently [5]. DBTT is determined using the Charpy impact test to avoid brittle fracture in metal materials. Toughness indicates the energy absorbed by the materials when they are broken. Ductile materials absorb a lot of energy before they are broken with a large transformation. On the other hand, brittle materials break apart with only a small transformation [6]. DBTT is usually considered to be the temperature corresponding to the point where half of the impact energy is absorbed by the metal [7].
The fracture area of the metal specimen is usually observed using an optical microscope method called fractography. The fracture area of the specimen is divided into four parts, for each characteristic mechanism: flat fracture, shear lip, crack initiation and final fracture [6,8]. However, it is common to divide the fracture into ductile and brittle fractures. Ductile fracture indicates a border of the specimen with characteristic lusterless and dark looking features, and brittle fracture represents the center of the specimen that relatively looks glossy and bright. The temperature that causes 50 percent ductile and brittle fractures is called the fracture appearance transition temperature (FATT) [9]. As shown in Fig 1, the analyzer needs to provide a visual judgment based on the criteria specified by ASTM E23 [10]. However, it is well known that accurate analysis results cannot be obtained using the ASTM standard criteria.
Criteria for analysis of fracture area in ASTM standard E23-18.
2.2 Image Processing Technique
To resolve the related problems involving the analysis of the Charpy impact test based on ASTM standard, a new method based on image processing technique was proposed to automatically calculate the percentage of the ductile and brittle fractures. In this method, texture segmentation is applied to distinguish the shapes in an image, using textural differences, after converting an RGB fracture image from the optical microscope into a gray image [11]. As shown in Fig 2, a binary image with pixel values of only 0 and 1 can be obtained as a final image.
Conversion of impact test fracture image with image processing technique.
It is necessary to convert the RGB image to a binary image in order to calculate the ductile fracture quantitatively. The final binary image consists of 0 and 1 pixels. The parts with pixel values of 1 correspond to the brittle fracture area and those with pixel values of 0 represent the ductile fracture area, as shown in Fig 2. As a result, counting just the number of 0 pixels in the entire area automatic calculates the percentage of ductile fracture.
3. Results and Discussions
Sample 1 was prepared to verify the performance and accuracy of the automatic fracture analysis technique proposed in this study. The RGB fracture image of Sample 1 obtained from the optical microscope was converted into the gray image shown in Fig 3. The conversion to the corresponding gray image was accomplished by applying guided image filtering, which is one of the filtering techniques used in image processing. Filtering is a basic operation used in image processing and computer vision to modify or improve an image. Bilateral filtering is one of filtering techniques commonly used for edge-preserving and noise-smoothing [12]. It is well known that the guided image filtering used in this study is as effective as bilateral filtering but performs better near the edge [13-14].
Conversion of the RGB fracture image of Sample 1 into a gray image.
A binary masked image was created based on the fracture image using the guided image filtering. The binary masked image changes all values greater than a critical value to 1, and all other values to 0, converting the two-dimensional gray image into a binary image. The Otsu method is usually used to select a critical value by minimizing the distribution within the class of binary black and white pixels used to create the binary image [15-17]. As a result, the internal pixel value in the masked image is set to 1 and the external pixel value to 0.

Creation of a masked image of Sample 1.
Three texture filter functions can be used to filter the image using the standard statistical measurements: a range filter, standard deviation filter, and entropy filter [18-19]. The range filter calculates the local range of the image, the standard deviation filter calculates the local standard deviation of the image, and the entropy filter calculates the local entropy of the image [20]. Fig 5 shows the results when the three texture filter functions are applied to the masked image of the fracture area. When both the standard deviation filter and the entropy filter are applied, we can see that the brittle fracture area rarely appears in the image. On the other hand, the range filter confirms that the brittle fracture is separated from the ductile fracture, and makes it very visible in the image. For this reason, among the types of texture filter functions the range filter was selected and applied in the present work.

Results of application of three texture filter functions.
Pixels above a certain size were selected in the binary image with the range filter, and the resulting final image was obtained by removing small pixels, as shown in Fig 6.

Binary image after separating the brittle fracture areas in Sample 1.
In Fig 7, the white area depicts the brittle fracture, with the pixel values set to 1, and the black area represents the ductile fracture with the pixel values set to 0 in the final image.
Simplicity of each pixel value set to 0 and 1 in final binary image.
The number of pixels with values set to 1, which represent the brittle fracture, were divided by the total number of pixels in the entire fracture area to obtain a more accurate percentage of brittle fracture, as shown in Fig 8.

Calculation of the percentage of the ductile and brittle fracture areas.
The percentage of ductile fracture can also be calculated by counting the number of pixels with values set to 0, which indicates ductile fracture. The obtained results were validated by applying the automatic fracture analysis program based on the image processing developed in this study after preparing samples with different fracture shapes than Sample 1. The resultant images are shown in Fig 9. We can see that the brittle fractures are clearly distinguished in the final binary images in Fig 9(d).

Results of applying the automatic fracture analysis program to Samples 2 to 4.
Table 1 shows the percentage of ductile and brittle fractures calculated by counting the number of pixels with values set to 0 and 1 in the binary images, obtained from Samples 1 to 4. In conclusion, it was confirmed that the percentage of ductile and brittle fractures could be quantitatively calculated by using the automatic fracture analysis program based on image processing.
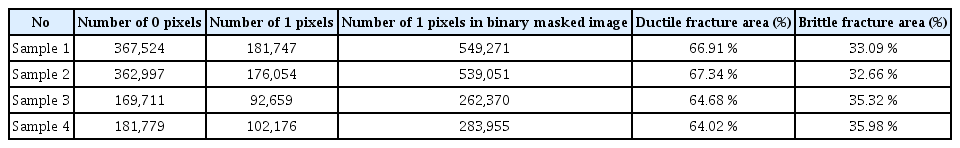
The percentage of the ductile and brittle fracture in from Sample 1 to Sample 4
4. Conclusions
The Charpy impact test was used to identify the transition from ductility to brittleness. The percentage of ductile and brittle fractures that was calculated based on the visual judgement of the fracture area by the analyzer could not be used to perform an accurate quantitative analysis.
In this work, a new fracture analysis program that calculates the percentage of the ductile and brittle fractures was proposed and compared with various image processing techniques. It was found that the proposed method can selectively distinguish the brittle fracture from the entire fracture area, and that the percentages of ductile and brittle fractures can be quantitatively calculated as well. The present method is expected to be useful for calculating a precise DBTT, to avoid brittle fracture when designing metal products.