Effects of Ge Doping on the Charge Transport and Thermoelectric Properties of Permingeatites Cu3Sb1−yGeySe4
Article information
Abstract
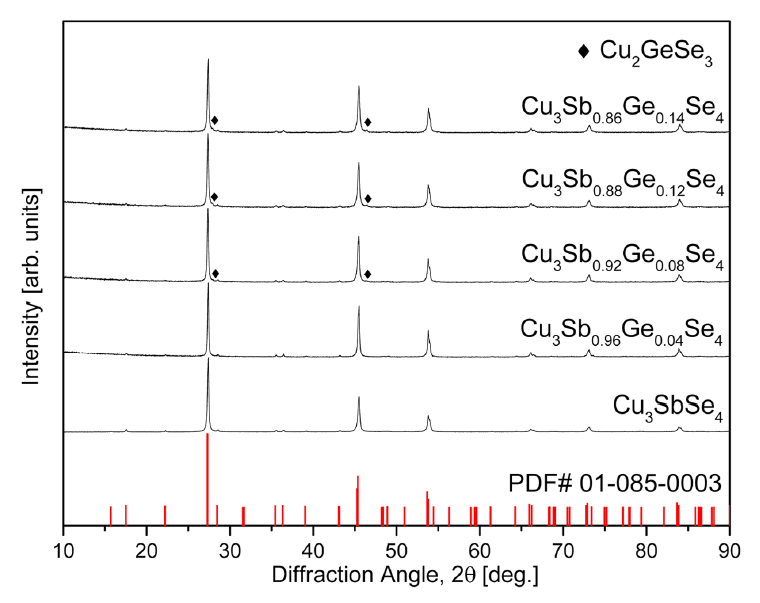
Permingeatites Cu3Sb1−yGeySe4 (0 ≤ y ≤ 0.14) were synthesized by mechanical alloying and hot pressing. The charge-transport parameters (Hall coefficient, carrier concentration, mobility, and Lorenz number) and thermoelectric properties (electrical conductivity, Seebeck coefficient, power factor, thermal conductivity, and figure of merit) were examined with respect to the Ge doping level. A single permingeatite phase with a tetragonal structure was obtained without subsequent heat treatment, but a small amount of the secondary phase Cu2GeSe3 was found for the specimens with y ≥ 0.08. All hot-pressed compacts exhibited a relative density of 97.5%–98.3%. The lattice constants of the a-axis and c-axis were decreased by the substitution of Ge at the Sb sites. As the Ge content increased, the carrier concentration increased from 5.2 × 10¹⁸ to 1.1 × 1020 cm−3, but the mobility decreased from 92 to 25 cm2·V−1·s−1. The Lorenz number of the undoped Cu3SbSe4 implied a non-degenerate semiconductor behavior, ranging from (1.57–1.56) × 10−8 V2·K−2 at 323–623 K. The thermoelectric figure of merit was 0.39 at 623 K, resulting from a power factor of 0.49 mW·m−1·K−2 and a thermal conductivity of 0.76 W·m−1·K−1. However, the Lorenz numbers of the Gedoped specimens indicated degenerate semiconductor characteristics, increasing to (1.63–1.94) × 10−8 V2·K−2 at 323–623 K. The highest thermoelectric figure of merit of 0.65 was at 623 K for Cu3Sb0.86Ge0.14Se4, resulting from the significantly improved power factor of 0.93 mW·m−1·K−2 and the thermal conductivity of 0.89W·m−1·K−1. As a result, the thermoelectric properties were remarkably enhanced by doping Ge into the Sb sites of the permingeatite.
1. Introduction
Recently, thermoelectric materials composed of non-toxic, eco-friendly, low-cost, and earth-abundant elements have attracted attention, and Cu-Sb-Se ternary chalcogenides are among those materials considered to be promising candidates [1-3]. Among these, Cu3SbSe3 (bytizite) and Cu3SbSe4 (permingeatite) are expected to be superior thermoelectric materials because of their inherently low thermal conductivities. Cu3SbSe3 exhibits a low lattice thermal conductivity because of the lone-pair electrons of Sb3+, while Cu3SbSe4 has an unusually low lattice thermal conductivity without lone-pair electrons because the valence electrons of Sb5+ participate in bonding [4]. The electronic structure, thermal properties, phase diagram, and doping effects of Cu3SbSe4 were investigated by Wernick and Benson [5]. Cu3SbSe4 belongs to the space group
The effects of dopants on the thermoelectric properties of Cu3SbSe4 have been studied in efforts to improve them. Zhao et al. [11] reported a ZT of 0.54 at 650 K for Cu3Sb0.985Ga0.015Se4, and Li et al. [12] obtained a ZT of 0.58 at 600 K for Cu3Sb0.97Al0.03Se4. Li et al. [13] reported a ZT of 0.70 at 600 K for Cu3Sb0.98Bi0.02Se4, and Wei et al. [14] achieved one of 0.70 at 673 K for Cu3Sb0.98Sn0.02Se4. The ionic radius of Ge4+ is similar to that of Sb5+, and Ge contains one fewer valence electrons than Sb, suggesting that Ge is a great acceptor for Cu3SbSe4. Chang et al. [15] prepared Cu2.95Sb0.96Ge0.04Se4 by melting at 1123 K for several hours, annealing at 653 K for 40 h, and spark plasma sintering (SPS); the material had a ZT of 0.70 at 640 K. Skoug et al. [9] synthesized Cu3Sb0.98Ge0.02Se4 by melting at 1173 K for 12 h, annealing at 573 K for 48 h, and hot pressing (HP), obtaining a ZT of 0.68 at 630 K. In our previous study [16], we successfully synthesized Cu3SbSe4 via a solid-state route with mechanical alloying (MA; 350 rpm, 12 h) and sintering by hot pressing (HP; 673 K, 2 h, 70 MPa). Although the ZT value of the undoped Cu3SbSe4 was only 0.39 at 623 K, the thermoelectric performance may be enhanced by doping.
In this study, Ge-doped permingeatite Cu3Sb1−yGeySe4 (0 ≤ y ≤ 0.14) powders were synthesized by MA and consolidated by HP, and the effects of Ge doping on the charge-transport and thermoelectric properties were examined.
2. Experimental Procedure
To synthesize Ge-doped permingeatites Cu3Sb1−yGeySe4 (y = 0, 0.04, 0.08, 0.12, and 0.14), Cu (<45 μm, purity 99.9%, Kojundo), Sb (<150 μm, purity 99.999%, Kojundo), Ge (<45 μm, purity 99.99%, Kojundo), and Se (<10 μm, purity 99.9%, Kojundo) powders were stoichiometrically weighed. The mixed powders were mechanically alloyed using a planetary ball mill (Fritsch, Pulverisette5) at 350 rpm for 12 h in an Ar atmosphere. The synthetic permingeatite powders were sintered using HP with a graphite die with an inner diameter of 10 mm at 573 K for 2 h at 70 MPa. The detailed MA-HP process for permingeatite was reported in our previous study [16]. The sintered compacts were cut into discs of 1 mm (thickness) × 10 mm (diameter) to measure the Hall coefficient and thermal diffusivity, and cut into parallelepipeds of 3 mm × 3 mm × 9 mm to measure electrical conductivity and Seebeck coefficient.
The phases were analyzed by X-ray diffraction (XRD; Bruker, D8-Advance) with Cu Kα radiation (40 kV, 30 mA). The diffraction angles were measured in the 2θ range 10–90 ° with a scanning step of 0.02 ° and a step duration of 0.4 s. The lattice constants were calculated by Rietveld refinement using the TOPAS program. The microstructures of the hotpressed specimens were observed by scanning electron microscopy (SEM; FEI, Quanta400) in the backscattered electron (BSE) mode. Elemental line scans and maps were obtained by energy-dispersive spectrometry (EDS; Bruker, XFlash4010), employing the energy levels of the Cu K-series (8.046 eV), Sb L-series (3.604 eV), Ge K-series (9.886 eV), and Se K-series (11.224 eV). Charge-transport parameters were examined by measuring the Hall coefficient with a magnetic field (1 T) and electric current (100 mA DC) using the van der Pauw method (Keithley 7065). The thermoelectric properties were measured at temperatures of 323–623 K. The thermal conductivity was estimated from the thermal diffusivity, specific heat, and density using a TC-9000H (Advance Riko) system with the laser flash method in a vacuum. The Seebeck coefficient and electrical conductivity were measured using a ZEM-3 (Advance Riko) instrument with the four-probe method in a He atmosphere. The power factor and thermoelectric figure of merit ZT were also evaluated.
3. Results and Discussion
Figure 1 shows the XRD patterns of Cu3Sb1−yGeySe4 processed by MA-HP. The diffraction peaks matched the standard diffraction pattern (ICDD PDF# 01-085-0003) for permingeatite and confirmed that the samples had tetragonal structures (space group
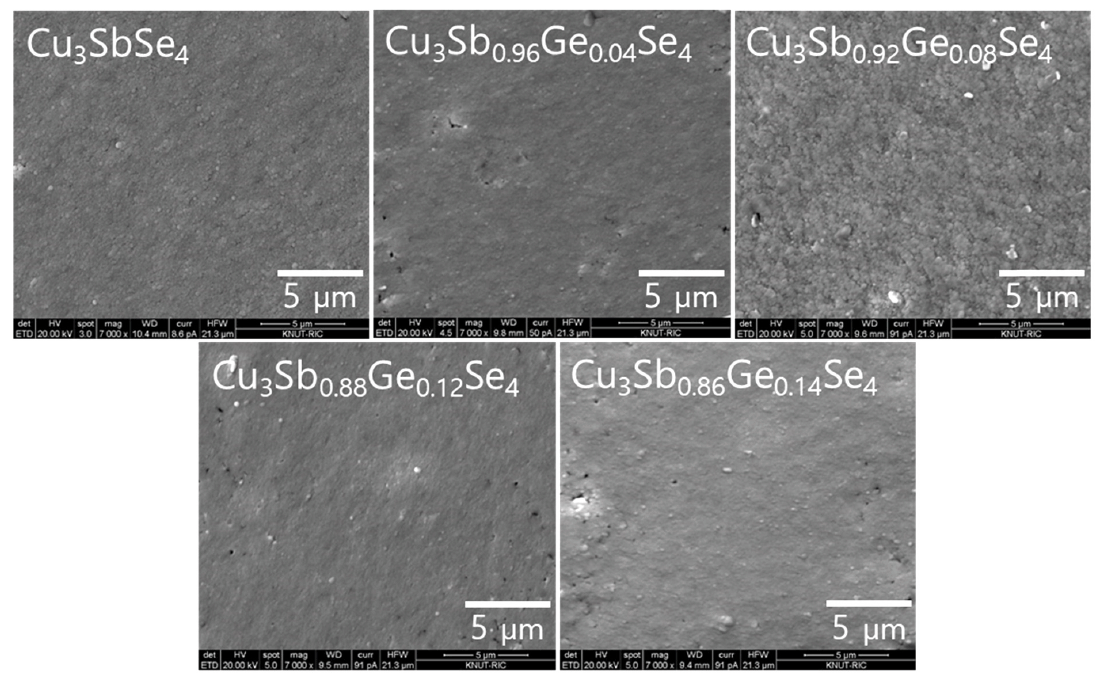
Figure 2 shows the SEM images of the fractured surfaces of the Cu3Sb1−yGeySe4. The hot-pressed compacts showed relative densities of 97.5%–98.3% as shown in Table 1; the theoretical density of permingeatite is 5.82 g·cm−3 [18]. The microstructure did not significantly change with changes in Ge content, however, the secondary phase was observed for the specimens with y ≥ 0.08.
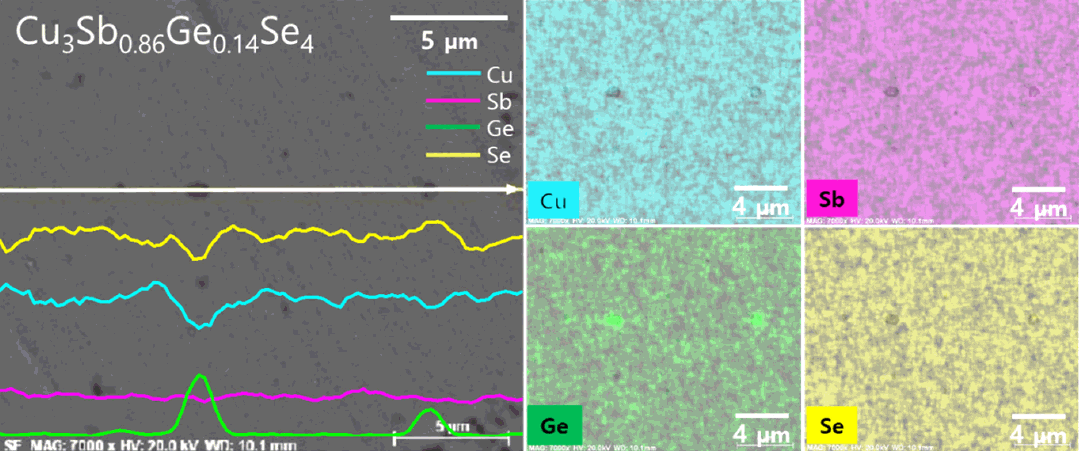
Figure 3 shows the BSE-SEM micrographs and elemental analyses of Cu3Sb0.86Ge0.14Se4. The matrix phase (gray region) and secondary phase (black region) were identified as permingeatite and Cu2GeSe3, respectively, which was confirmed by the XRD phase analysis (Fig 1). The EDS elemental line scans and maps indicated that each constituent element was homogeneously distributed except in the secondary-phase areas. The actual compositions of all specimens, listed in Table 1, were similar to the nominal compositions within the analysis error range.
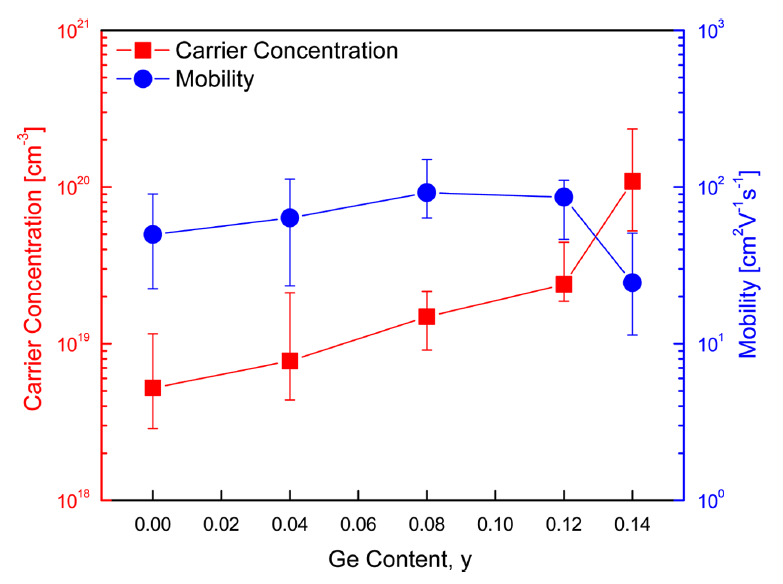
Figure 4 shows the carrier concentration and mobility of the Cu3Sb1−yGeySe4. The carrier concentration and mobility of undoped Cu3SbSe4 were 5.2 × 1018 cm−3 and 50 cm2·V−1·s−1, respectively. As the Ge content increased, the carrier concentration increased to (0.1–1.0) × 1020 cm−3. However, the mobility rapidly decreased to 24 cm2·V−1·s−1 because of the significant increase in the carrier concentration of the specimen, with y = 0.14. Chang et al. [15] reported an increase in carrier concentration from 8.0 × 10¹⁸ to 3.2 × 1020 cm−3 but a decrease in mobility from 76 to 21 cm2·V−1·s−1 for Cu2.95Sb1−yGeySe4 (y = 0–0.06) with increasing Ge content. Brooks et al. [19] suggested that mobility generally decreases with increases in the carrier concentration in non-degenerate semiconductors. In this study, the carrier concentration and mobility increased with increasing Ge content, although the mobility decreased when y > 0.08. This was because the Ge doping transforms the semiconducting state from nondegenerate to degenerate, and because the lattice distortion and ionized impurities enhanced the carrier scattering [14].
Figure 5 shows the electrical conductivity of Cu3Sb1−yGeySe4. In the specimens with y ≤ 0.04, the electrical conductivity increased slightly with increasing temperature, indicating non-degenerate semiconductor behavior. The electrical conductivity of the specimens with y ≥ 0.08 decreased with increasing temperature, indicating degenerate semiconductor behavior. At a constant temperature, the electrical conductivity increased with Ge doping. For the undoped Cu3SbSe4, the electrical conductivity was (4.2–4.5) × 103 S·m−1 at 323–623 K, whereas the Ge-doped specimens exhibited increased values of (0.8–4.3) × 104 S·m−1 at 323 K and (0.7–2.9) × 104 S·m−1 at 623 K. Skoug et al. [9] reported that the electrical conductivity of Cu3SbSe4 showed a negative temperature dependence and a value of (8.3–4.0) × 102 S·m−1 at 80–630 K, whereas that of Cu3Sb1−yGeySe4 (y = 0.01–0.03) increased to (0.3–1.1) × 104 S·m−1 at 80 K and (1.3–4.0) × 103 S·m−1 at 630 K because the carrier concentration was increased to 1018–1020 cm−3 by Ge doping. Chang et al. [15] obtained an electrical conductivity of (1.0–1.1) × 103 S·m−1 at 300–640 K for Cu2.95SbSe4. However, the increased values of (0.3–1.1) × 104 S·m−1 at 300 K and (1.7–5.6) × 104 S·m−1 at 623 K for Cu2.95Sb1−yGeySe4 (0.01 ≤ y ≤ 0.06) indicated a positive temperature dependence, which was attributed to the increase in carrier concentration from 8.0 × 10¹⁸ to 3.2 × 1019 cm-3 through Ge doping. In this study, the electrical conductivity was also increased by the increase in carrier concentration caused by Ge doping, as shown in Fig 4, resulting from the additional carriers (holes) generated by Ge4+ substituted at the Sb5+ sites.
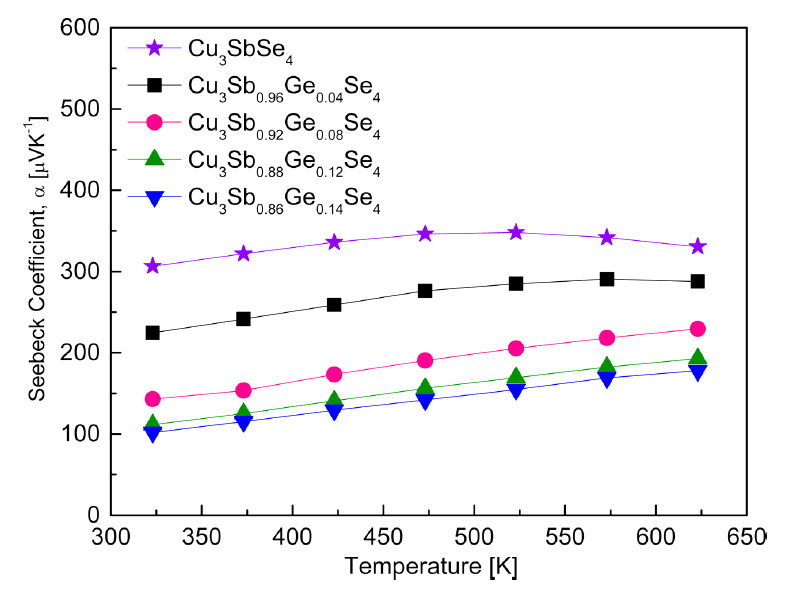
Figure 6 shows the Seebeck coefficients of Cu3Sb1−yGeySe4. All specimens exhibited p-type conduction characteristics, and the majority carriers were holes, as confirmed by the positive signs of both the Seebeck coefficient and Hall coefficient. The Seebeck coefficient of Cu3SbSe4 increased from 307 μV·K−1 at 323 K to 348 μV·K−1 at 523 K, and then decreased to 331 μV·K−1 at 623 K. Therefore, the Seebeck coefficient of undoped Cu3SbSe4 was decreased by the significant increase in carrier concentration, owing to the intrinsic transition at temperatures above 523 K. However, for the specimen with y = 0.04 the intrinsic transition occurred at temperatures above 573 K, whereas it did not occur at temperatures up to 623 K for the specimens with y ≥ 0.08. This implies that increases in the Ge doping level (carrier concentration) shifted the intrinsic transition to higher temperatures.
As the Ge content increased, the Seebeck coefficient decreased from 225 to 102 μV·K−1 at 323 K and from 288 to 178 μV·K−1 at 623 K due to the increase in carrier concentration. Skoug et al. [9] reported that the Seebeck coefficient of Cu3SbSe4 reached 300–400 μV·K−1 at 80–630 K, with the maximum value at 320 K. However, as the Ge content increased, the Seebeck coefficient of Cu3Sb1−yGeySe4 (y = 0.01–0.03) decreased from 70 to 45 μV·K−1 at 80 K and from 200 to 130 μV·K−1 at 630 K. Chang et al. [15] reported that the Seebeck coefficient of Cu2.95SbSe4 exhibited the highest value of 350 μV·K−1 at 450 K, and then decreased to 275 μV·K−1 at 640 K owing to the intrinsic transition of the material; however, the Seebeck coefficient of Cu2.95Sb1−yGeySe4 (y = 0.01–0.06) decreased to 160–69 μV·K−1 at 300 K and 225–130 μV·K−1 at 640 K because of the increase in carrier concentration by Ge doping.
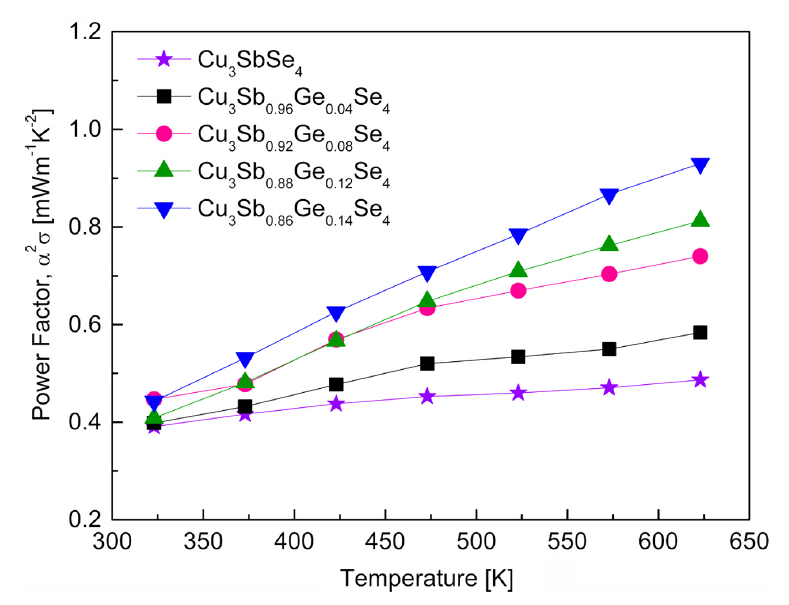
Figure 7 shows the power factor of Cu3Sb1−yGeySe4. The power factor (PF = α2σ) is proportional to the Seebeck coefficient (α) and electrical conductivity (σ); thus, it increases as the temperature increases due to the temperature dependences of the Seebeck coefficient and electrical conductivity. The power factor of Cu3SbSe4 was as low as 0.39–0.49 mW·m−1·K−2 at 323–623 K with a small temperature dependence. However, as the Ge content increased, the power factor increased with a larger temperature dependence; Cu3Sb0.86Ge0.14Se4 exhibited the highest values of 0.44–0.93 mW·m−1·K−2 at 323–623 K. The electrical conductivity and Seebeck coefficient have a trade-off relationship with the carrier concentration [20]. In this study, Cu3Sb0.86Ge0.14Se4 had the maximum power factor because it showed the highest electrical conductivity, despite also having the lowest Seebeck coefficient. Skoug et al. [9] reported the low power factor of 0.10–0.43 mW·m−1·K−2 at 80–630 K for Cu3SbSe4, but higher values of 0.19–1.55 mW·m−1·K−2at 80–630 K for Cu3Sb1−yGeySe4 (y = 0.02 and 0.03). Chang et al. [15] reported power factors of 0.81–1.15 mW·m−1·K−2at 300–640 K for Cu2.95SbSe4 and 0.50–1.35 mW·m−1·K−2 at 300–640 K for Cu2.95Sb1−yGeySe4 (y = 0.01–0.06).
Figure 8 shows the thermal conductivity of the Cu3Sb1−yGeySe4. As shown in Fig 8(a), the thermal conductivity decreased with increasing temperature. The thermal conductivity of undoped Cu3SbSe4 was 1.19–0.74 W·m−1·K−1 at 323–623 K, while Ge-doped specimens exhibited increased values of 1.27–1.36 W·m−1·K−1 at 323 K and 0.76–0.89 m−1·K−1 at 623 K. The thermal conductivity (κ) is expressed as κ = Dcpd, the product of the thermal diffusivity (D), specific heat (cp), and density (d). Therefore, the thermal conductivity is affected by the phases, compositions, and microstructures (grain boundaries, defects, pores, etc.), which depend on the preparation process. Skoug et al. [9] obtained the thermal conductivity of 15.0–1.0 W·m−1·K−1 at 80–630 K for Cu3Sb1−yGeySe4 (y = 0.02 and 0.03) prepared by the melting–annealing and HP method. Chang et al. [15] reported a thermal conductivity of 2.98–1.25 W·m−1·K−1 at 300–640 K for Cu2.95SnyGe1−ySe4 (y = 0–0.06) fabricated by the melting–annealing and SPS methods. Compared with these reports, in this study, significantly lower thermal conductivity values of 1.36–0.74 W·m−1·K−1 were achieved at 323–623 K for Cu3Sb1−yGeySe4 (y = 0.04–0.14) by employing the MA-HP process.
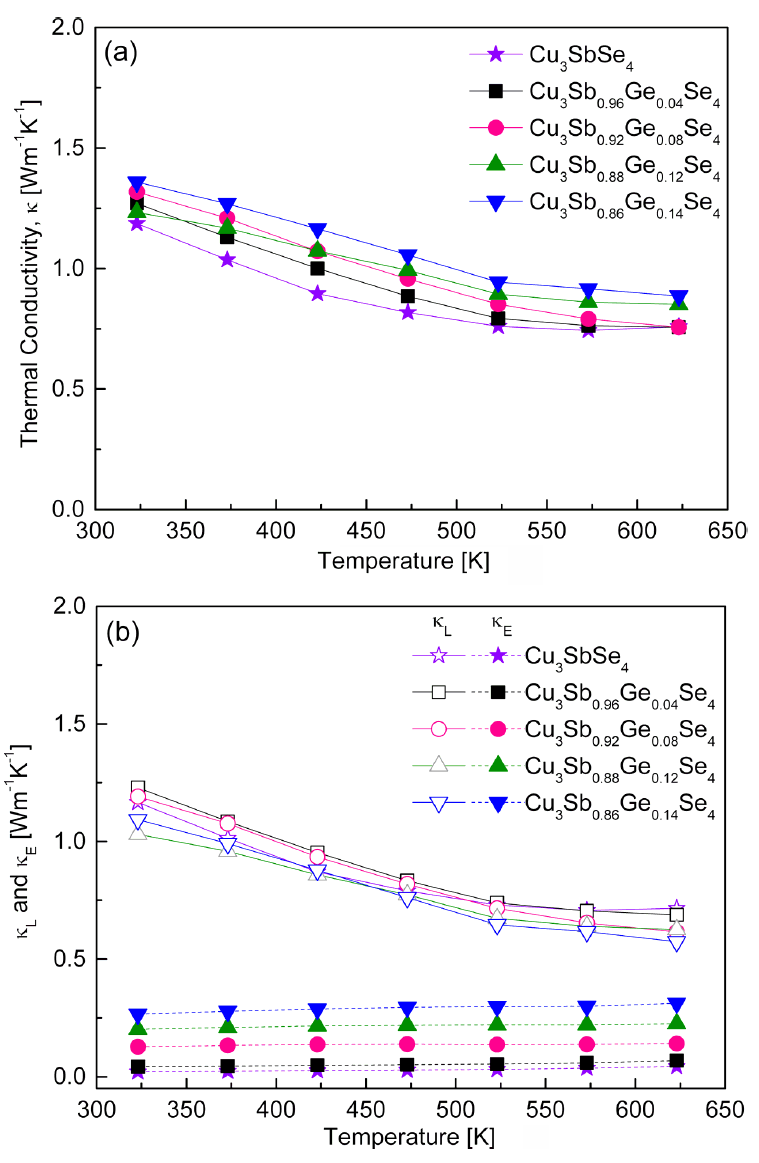
Temperature dependence of the thermal conductivity for Cu3Sb1-yGeySe4: (a) total thermal conductivity and (b) lattice and electronic thermal conductivities.
The thermal conductivity is the sum of the lattice thermal conductivity (κL) and electronic thermal conductivity (κE), which are attributed to phonons and charge carriers, respectively [21]. Figure 8(b) shows the lattice and electronic thermal conductivities estimated using the Wiedemann–Franz law (κE = LσT), where L is the temperature-dependent Lorenz number and T is the absolute temperature [9]. The lattice thermal conductivity and electronic thermal conductivity of Cu3SbSe4 were 1.17–0.72 W·m−1·K−1 and 0.02–0.04 W·m−1·K−1 at 323–623 K, respectively. The lattice thermal conductivity of Ge-doped specimens decreased to 1.23–1.09 W·m−1·K−1 at 323 K and 0.72–0.57 W·m−1·K−1 at 623 K because phonon scattering was enhanced by the ionized impurities and lattice distortions generated by Ge substitution at the Sb sites. However, the electronic thermal conductivity increased to 0.04–0.27 W·m−1·K−1 at 323 K and 0.07–0.31 W·m−1·K−1 at 623 K due to the increase in carrier concentration through Ge doping. As the Ge content increased, the lattice thermal conductivity decreased, while the electronic thermal conductivity increased. Therefore, the total thermal conductivity of Cu3Sb1−yGeySe4 was mainly determined by the lattice thermal conductivity, but the change in the total thermal conductivity was predominantly affected by the electronic thermal conductivity.
Figure 9 shows the Lorenz number of Cu3Sb1−yGeySe4. Theoretically, the Lorenz number is (1.45–2.44) × 10−8 V2·K−2 [22]; smaller values indicate non-degenerate semiconductor behavior, while larger values indicate degenerate semiconductor or metallic conductor behavior. As shown in Fig 8(b), the charge-carrier contribution to the thermal conductivity was determined using the Wiedemann–Franz law, and the Lorenz number was calculated using the equation [23]. In this study, the Lorenz number decreased with increasing temperature. The Lorenz numbers of undoped Cu3SbSe4 were low and constant between 1.57 × 10⁻⁸ and 1.56 × 10⁻⁸ V2·K−2 at 323–623 K. However, the Lorenz number increased to (1.64–1.92) × 10−8 V2·K−22 at 323 K and (1.56–1.72) × 10−8 V2·K−2 at 623 K with increasing Ge content at constant temperature.
Figure 10 presents the dimensionless figure of merit for Cu3Sb1−yGeySe4. The dimensionless figure of merit was evaluated using the relationship ZT = α2σκ-1T. ZT increased with increasing temperature because of the temperature dependences of the power factor and thermal conductivity. Cu3SbSe4 exhibited a maximum ZT of 0.39 at 623 K, whereas the ZT was significantly improved by Ge doping. Cu3Sb0.86Ge0.14Se4 showed the highest ZT (0.65) at 623 K. Although Ge doping increased the thermal conductivity, the ZT improvement arose from the remarkably increased power factor. Skoug et al. [9] reported a ZT of 0.68 at 630 K for Cu3Sb0.98Ge0.02Se4 prepared by melting at 1173 K for 12 h and annealing at 573 K for 48 h followed by HP. Chang et al. [15] obtained a ZT of 0.54 at 640 K for Cu2.95SbSe4 and 0.70 at 640 K for Cu2.95Sb0.96Ge0.04Se4 synthesized by melting at 1123 K for several hours, annealing at 653 K for 40 h, and SPS.
In this study, solid-state synthesis via the MA-HP process was successful in preparing Ge-doped permingeatite compounds in a relatively short time (MA for 12 h) without subsequent heat treatment. The MA-HP method was confirmed to be an economical and practical process that saved time and energy in the fabrication of homogenous Ge-doped permingeatite. The obtained thermoelectric performance was comparable to that of permingeatite produced by the melting process.
4. Conclusions
Ge-doped permingeatites Cu3Sb1−yGeySe4 (y = 0–0.14) were successfully prepared by MA and HP. The phase, microstructure, charge transport, and thermoelectric properties were examined with respect to the Ge content. A permingeatite phase with a tetragonal structure was formed in all samples, and the secondary phase of Cu2GeSe3 was detected when y ≥ 0.08. Both undoped and Ge-doped specimens exhibited p-type characteristics, and the carrier (hole) concentration increased with increasing Ge content. Cu3SbSe4 showed non-degenerate semiconductor behavior, while the Ge-doped specimens were degenerate in nature. As the Ge content increased, the Seebeck coefficient decreased, while the electrical conductivity and power factor increased. However, the thermal conductivity increased because of the increased electronic thermal conductivity. As a result, Cu3Sb0.86Ge0.14Se4 achieved the maximum ZT of 0.65 at 623 K, resulting from its low thermal conductivity of 0.89 W·m−1·K−1 and maximized power factor of 0.93 mW·mm−1·K−2.
Acknowledgements
This study was supported by the Basic Science Research Capacity Enhancement Project (National Research Facilities and Equipment Center) through the Korea Basic Science Institute funded by the Ministry of Education (Grant No. 2019R1A6C1010047).
