Bandgap Reduction and Enhanced Photoelectrochemical Water Electrolysis of Sulfur-doped CuBi2O4 Photocathode
Article information
Abstract
As interest in hydrogen energy grows, eco-friendly methods of producing hydrogen are being explored. CuBi2O4 is one of the p-type semiconductor cathode materials that can be used for photoelectrochemical hydrogen production via environment-friendly water electrolysis. CuBi2O4 has a bandgap of 1.5 – 1.8 eV which allows it to photogenerate electrons and holes from the absorption of visible light. This study investigated the effect of sulfur doping on the bandgap and photoelectrochemical water reduction properties of CuBi2O4. Sulfur-doped CuBi2O4 thin films were electrochemically synthesized using a nitrate-based precursor solution with thiourea. This was followed by two-step annealing in an Ar atmosphere, which effectively prevented the oxidation of sulfur. Sulfur doping up to 0.1 at% led to the expansion of the lattice volume of the CuBi2O4. The bandgap was reduced from 1.9 eV to 1.5 eV with increasing doping concentration, which resulted in the enhancement of photoelectrochemical current density by ~240%. X-ray photoelectron spectroscopy showed that sulfur-doping reduced oxygen vacancies with increasing doping concentration, confirming that the enhanced photoelectrochemical properties resulted from the reduction in bandgap, not from any extrinsic factor such as oxygen vacancies. Further studies of sulfur-doped CuBi2O4 to improve surface coverage are expected to lead to a more promising photoelectrochemical cathode material.
1. INTRODUCTION
As global warming and the depletion of fossil fuels have raised increasing worldwide concern, the importance of finding eco-friendly and sustainable renewable energy sources has grown. Among them, hydrogen energy can be produced in an eco-friendly way through water splitting, and has the further advantages of not generate pollutants during production, and being continuously available since its source is abundant water. One of the promising methods for performing water electrolysis is a PEC cell which uses renewable solar energy as its source.
Demand for hydrogen energy is increasing worldwide, and to meet this demand, it is important to improve the efficiency of water splitting. In recent years, it has become more important to produce hydrogen in an environmentally friendly manner, and photoelectrochemical (PEC) water electrolysis which uses renewable solar energy as its source is emerging as the most promising method. However, the efficiency of PEC water splitting reported so far is too low to be commercialized. The wavelength absorption range of the several photocathodes reported for hydrogen production has been limited to the ultraviolet range, for example, SrTiO3 (~388 nm) [1], TiO2 (~410 nm) [1], CdS (~500 nm) [2] and TaON (~500 nm) [3]. Recently, copper bismuth oxide (CuBi2O4, CBO), a new p-type semiconductor, was investigated for photoelectrochemical (PEC) water electrolysis because of its suitable characteristics. First, CBO has a wavelength absorption range of about 800 nm [4] and it has been reported to have a band gap of 1.7 eV –2.0 eV, which allows it to absorb the visible range of solar energy. Second, the conduction band minimum (CBM) is more negative than the thermodynamic potential associated with water reduction, which enables hydrogen production on the electrode surface [5]. Third, the Valence Band Maximum (VBM) is more positive than Cu2O, which is currently the most promising photocathode [6]. Fourth, it is resistant to photo corrosion because it is much more stable than copper-based binary compounds such as Cu2O and CuO [7].
The photocurrent of CBO during PEC water electrolysis, however, remains relatively low compared to other well-known photocathode materials for PEC water splitting. One way to improve the PEC properties of CBO is to enhance carrier transport and to reduce its bandgap. Anion doping can be one of the solutions [8,9].
This study explored how sulfur doping CBO affected bandgap reduction and PEC water electrolysis properties. Doping BiVO4, a well-known photocathode, with sulfur atoms was recently reported to decrease bandgap by 0.3 eV, and to increase carrier diffusion length by ~70% [10]. It has also been reported that the crystal symmetry was distorted, and the optical gap of the electronic band structure was reduced when the oxygen atoms in the oxides were replaced by sulfur atoms [11,12]. S-doped CBO thin films were electrochemically synthesized on FTO, and sulfur of 0.1~0.2 at% resulted in a bandgap reduction of 0.4 eV, and a ~240% increase in photocurrent density.
2. EXPERIMENTAL
2.1 Electrochemical synthesis of sulfur-doped CuBi2O4 thin films on FTO
All chemicals were used as purchased without further purification. Bi(NO3)3·5H2O (Sigma Aldrich, 98%) and Cu(NO3)2·2.5H2O (Sigma Aldrich, 98%) were dissolved in DMSO (Dimethyl sulfoxide, Sigma Aldrich, 99.9%) solvent at a 2:1 ratio and 100 mmol/L of KClO4 (Sigma Aldrich, 99.9%) was added [13-15]. Thiourea (CH4N2S, Sigma Aldrich, 99%) was used to control the sulfur doping concentration: CuBi2O4-xSx with x = 0, 0.02, 0.05, 0.1, and 0.5.
Electrodeposition was utilized in a three-electrode cell as depicted in Fig 1. FTO substrates (20×20 mm2) and Pt mesh were used as the working electrode and the counter electrode, respectively, with an Ag/AgCl reference electrode. Deposition was performed for 2, 4, 8, and 12 minutes at E = -1.5 V vs Ag/AgCl. Following the completion of thin films synthesis, two-step annealing was performed in a tube furnace at 200 °C and 500 °C for 2 hours and 2 hours, respectively, to form a CuBi2O4 phase [16]. Annealing was carried out in air or argon atmosphere. With the argon annealing, a BPR (Back Pressure Regulator) was used to keep the pressure inside the tube higher than the ambient air, to prevent the introduction of air back into the tube during annealing.
2.2 Characterization of the structure, bandgap, and PEC properties
The structures of the CuBi2O4-xSx thin films were examined by X-ray diffraction (Empyrean, Malvern Panalytical, UK). Bandgap was estimated by analyzing UV-vis absorption spectra. X-ray photoelectron spectroscopy (AXIS Supra+ Kratos, UK) was performed using Al-Kα (1486.6 eV). Photoelectrochemical properties were obtained by measuring I-V in a 0.1 mol/L NaOH solution (pH 12.75) with the illumination of AM 1.5 (100 mW/cm2).
3. RESULTS AND DISCUSSION
3.1 Unit cell expansion with sulfur doping
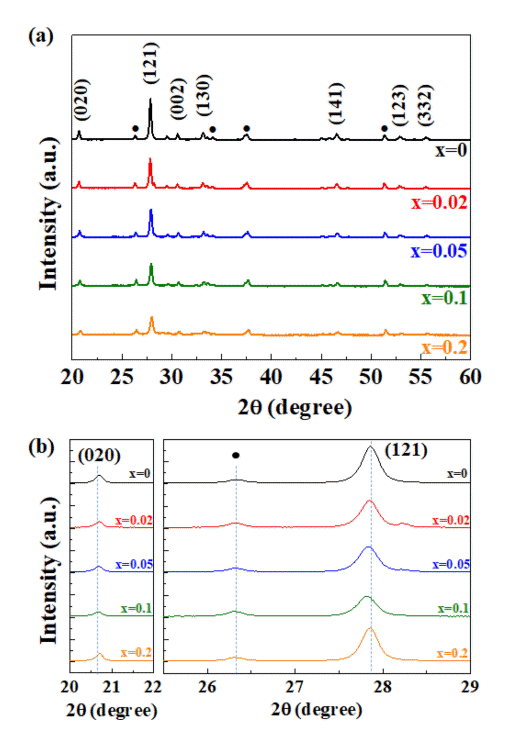
Comparing the XRD patterns in Fig 2(a), all of the S-doped CBO have the same structure as the undoped-CBO. In S-doped CBO, sulfur ions (S2-) should substitute the oxygen ions (O2-). The ionic radius of S2- (180 pm) is larger than the O2- (140 pm). As a result, the unit cell volume will expand with increasing doping concentration. The zoomed-in XRD patterns in Fig 2(b) show that the (121) and (020) reflections have shifted to lower angles with increasing concentration, which confirms the expansion of the unit cell volume by sulfur doping. The lattice expansion by sulfur doping has also been found in the BiVO4 photoanode material [10].

(a) XRD patterns of S-doped CBO thin films with the crystallographic plane index of CBO and (b) zoom-in for the (020) and (121) reflections of CBO. Black circles indicate XRD peaks from the FTO glass substrates.
However, for x = 0.2, those reflections returned to their original position, which is indicative of the solubility limit of sulfur doping in CBO when the electrochemical synthesis method is utilized. Another method, such as hydrothermal synthesis or vacuum deposition, may change this solubility limit of sulfur in CBO [17,18].
Other reflections like (002) and (130) that appear at around 2q = 30.6° and 33.25°, respectively, also shifted to lower angles with increasing concentration, although the change was not as great as (020) and (121). The change in d-spacing that corresponds to those reflections with the doping concentration is summarized in Table 1.
3.2 Reduction of bandgap and enhancement of PEC property
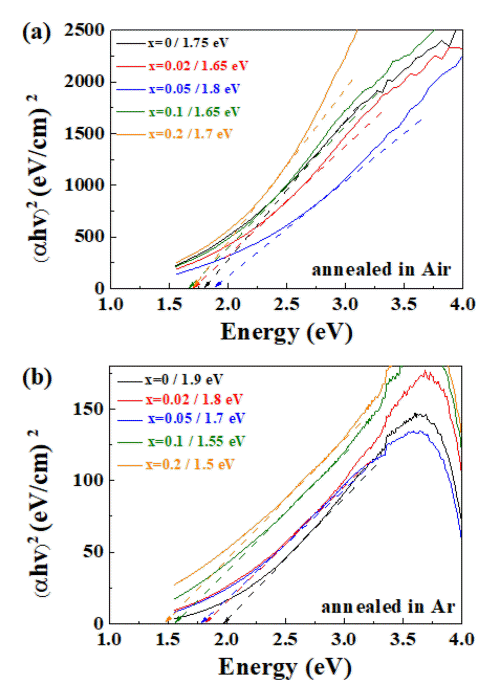
As presented in Fig 1(c), the color of the S-doped CBO thin films changed with the doping concentration, which should be related to the bandgap change in the CBO. To analyze the change quantitatively, UV-vis absorption spectra were obtained. Sulfur doping reduced the bandgap in the CBO, as shown in Fig 3. However, when the CBO films were annealed in air, the bandgap change was found to be irregular, without any trend. This is because the doped sulfur was being oxidized during annealing. When the S-doped CBO films were annealed in Ar atmosphere, the bandgap was systematically reduced, from 1.9 eV to 1.5 eV with increasing doping concentration.

UV-vis absorption spectra used to obtain the bandgaps of the S-doped CBO films annealed in (a) air and (b) Ar atmosphere. The obtained bandgaps are summarized with the sulfur doping concentration.
Fig 4 demonstrates the enhancement in PEC properties with sulfur doping. Because the structure of the x = 0.2 S-doped CBO returned to that of the original CBO, the PEC properties were compared at a doping concentration of x = 0.1. At a potential of 0.4 V (vs. RHE), the photocurrent density increased by ~240%.
3.3 Reduced surface oxygen vacancies with sulfur doping
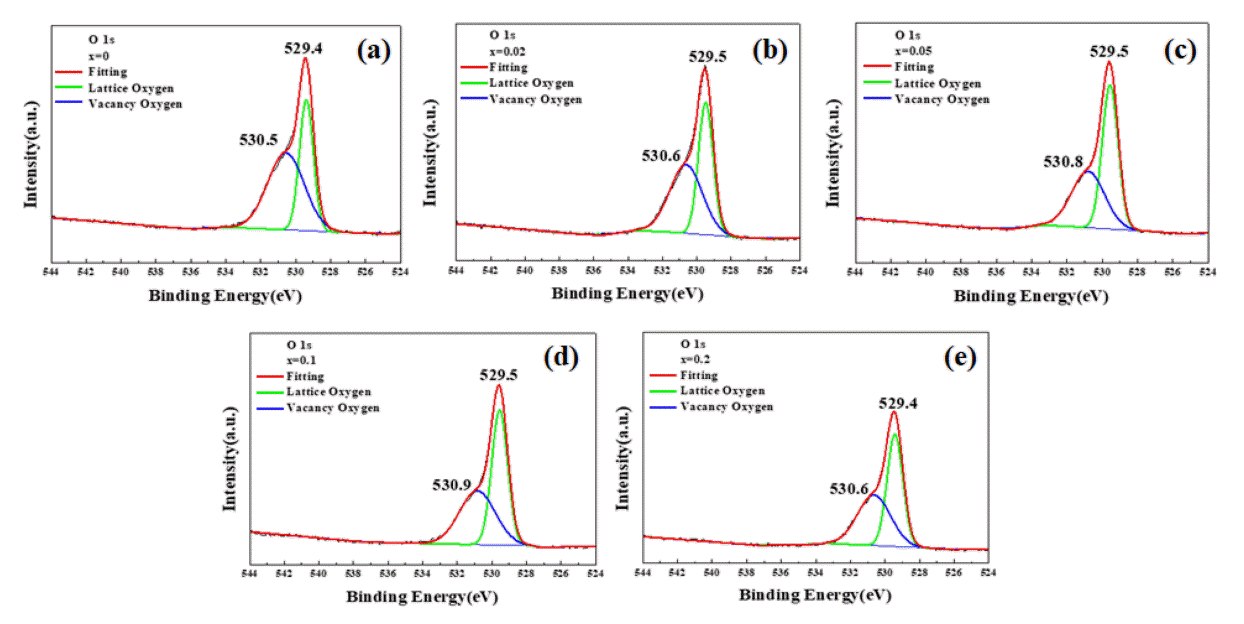
Fig 5 shows the XPS spectra of O 1s of the S-doped CBO films. The O 1s XPS spectra typically show two or three electronic states of oxygen species in oxides: strong peaks are shown in green for lattice oxygen atoms, and broad peaks with reduced intensity are shown in blue for oxygen vacancies with higher binding energy. The last case usually corresponds to the adsorbed oxygen species with higher binding energy and more reduced intensity [19-21]. As shown in Fig 5, only two peaks were found, which means adsorbed oxygen species can be neglected in this study. As summarized in Table 2, the ratio of the area that corresponds to oxygen vacancies decreases with the concentration. This implies that the enhanced PEC shown in Fig 4 is not due to any extrinsic effect, like vacancies, but instead is due to the bandgap reduction in CBO by sulfur-doping.

XPS O 1s spectra with sulfur doping concentrations of (a) x = 0, (b) x = 0.02, (c) x = 0.05, (d) x = 0.1, and (e) x = 0.2. The peaks can be deconvoluted into two peaks which correspond to lattice oxygens and oxygen vacancies.
5. CONCLUSIONS
This study explored the effect of sulfur doping on CuBi2O4, a promising photocathode material for PEC water electrolysis. When the S-doped CBO was electrochemically synthesized on FTO, the sulfur expanded the lattice volume of the CBO and reduced its bandgap from 1.9 eV to 1.5 eV. This enhanced current density by ~240% during the photoelectrochemical water electrolysis. The XPS O 1s spectra support that this enhancement can be attributed to the bandgap reduction, rather than any extrinsic factor like oxygen vacancies. Note that overall, there was a tendency for the current density to increase, but at a specific concentration, the results deviated from the trend. This may be because of the coverage, which is under further investigation. The results in this study reveal a new way to enhance the carrier transport and PEC properties of oxide semiconductors for unbiased water electrolysis.
Acknowledgements
This work was supported by Kyonggi University's Graduate Research Assistantship 2021 and the National Research Foundation of Korea (NRF) grant funded by the Korea government (NRF-2019R1F1A1064146).


