Electrical, Thermal, and Thermoelectric Transport Properties of Co-Doped n-type Cu0.008Bi2Te2.6Se0.4 Polycrystalline Alloys
Article information
Abstract
Bi2Te3-based alloys have been extensively studied as thermoelectric materials near room temperature. In this study, the electrical, thermal, and thermoelectric transport properties of a series of Co-doped n;-type Cu0.008Bi2Te2.6Se0.4 polycrystalline alloys (Cu0.008Bi2−xCoxTe2.6Se0.4, x; = 0, 0.03, 0.06, 0.09 and 0.12) are investigated. The electrical conductivity of the Cu0.008Bi1.97Co0.03Te2.6Se0.4 (x; = 0.03) sample was significantly enhanced, by 34%, to 1199 S/cm compared to 793 S/cm of the pristine Cu0.008Bi2Te2.6Se0.4 (x; = 0) sample at 300 K, and gradually decreased to 906 S/cm for x; = 0.12 upon further doping. Power factors of the Co-doped samples decreased compared to the 3.26 mW/mK<sup>2</sup> of the pristine Cu0.008Bi2Te2.6Se0.4 sample at 300 K. Meanwhile, the power factor of the Cu0.008Bi1.97Co0.03Te2.6Se0.4 (x; = 0.03) sample became higher at 520 K. The lattice thermal conductivities of the Co-doped samples decreased due to additional point defect phonon scattering by the Co dopant. Consequently, the zT; for the Cu0.008Bi1.97Co0.03Te2.6Se0.4 alloy at 520 K was 0.83, which is approximately 15% larger than that of pristine Cu0.008Bi2Te2.6Se0.4, while the zT; of the Cu doped samples at 300 K was smaller than that of the pristine Cu0.008Bi2Te2.6Se0.4 sample. Electrical transport properties of the Co-doped Cu0.008Bi2−xCoxTe2.6Se0.4 samples were analyzed by experimental phenomenological parameters, including the density-of-state, effective mass, weighted mobility, and quality factor.
1. INTRODUCTION
Bi 2 Te 3 -based alloys have been extensively studied as thermoelectric materials at room temperature. These materials are semiconductors with a narrow band gap (~ 0.13 eV) [1,2]. They have excellent electrical transport properties with a high carrier concentration (~ 1019 cm−3) and exhibit a relatively low thermal conductivity due to layered structures with a weak Van der Waals bonding between layers [3-5], resulting in a good thermoelectric figure of merit (zT) at room temperature [6,7]. Thermoelectric performance is evaluated by the dimensionless Figure of merit, zT = S2σT/κtot , where S, σ, T, and κtot are Seebeck coefficient, electrical conductivity, absolute temperature, and total thermal conductivity (κtot = κele + κlatt , where κele and κlatt are electron and lattice thermal conductivities, respectively), respectively. At elevated temperatures Bi2Te3-based alloys also induce an intrinsic excitation of electron-hole pairs, resulting in a decrease in S and an increase in κtot . Therefore, Bi2Te3-based alloys exhibit rapidly degrading thermoelectric performance above 500 K [8-10], which limits the application of Bi2Te3 alloys to low temperatures, of 450 K or less.
Pristine Bi2Te3 is an n-type semiconductor and is typically doped with Se into the Te-site to improve its thermoelectric performance. However, Bi2Te3 compositions exhibit unstable carrier transport properties because of self-defects, the formation of anti-site defects, and Te-site vacancies [11]. The unstable carrier transport properties of n-type Bi2Te3−xSex can be stabilized by adding Cu [12-15].
Defect engineering, such as doping, addition, and solidsolution, are the most used strategies for reducing κlatt by promoting point defect phonon scattering [16-19]. Doping strategies have been widely applied to enhance the thermoelectric transport properties of thermoelectric materials, particularly the n-type Bi2Te3-based alloys [19-22]. Lee et al. reported that using I-doping to improve the carrier transport properties of Cu0.008Bi2Te2.7Se0.3 enhanced zT to 0.86 at 400 K [21]. A higher zT of 1.07 at 423 K was observed in CuI-doped Bi2Te2.7Se0.3 processed by hot–deformation [22]. Similarly, Co doping was used to enhance the electrical transport properties of pristine Bi2Te3 and ptype Bi0.5Sb1.5Te3 [23,24].
However, Co-doping to Bi2Te3−xSex, a representative type of n-type Bi2Te3 based alloy, has not yet been reported. Therefore, in this study, the electrical, thermal, and thermoelectric transport properties of Cu0.008Bi2−xCoxTe2.6Se0.4 (x = 0, 0.03, 0.06, 0.09 and 0.12) polycrystalline bulk alloys were investigated. The electrical transport properties of a Codoped Cu0.008Bi2−xCoxTe2.6Se0.4 composition were analyzed by experimental phenomenological parameters, including the density-of-state effective mass (md*), weighted mobility (μw), and quality factor (B).
2. EXPERIMENTAL
Polycrystalline Cu0.008Bi2−xCoxTe2.6Se0.4 (x = 0, 0.03, 0.06, 0.09 and 0.12) samples were prepared via the solid-state reaction method. Stoichiometric ratios of high purity Bi (99.999%, 5N Plus), Te (99.999 %, 5N Plus), and Co (99.99%, Sigma Aldrich) were sealed in a quartz tube under a pressure of 10−5 Torr to prevent oxidation or other reactions with air. The raw materials placed in the sealed quartz ampoules were synthesized at 1323 K for 12 h (heating rate of 3 K/min), and then slowly cooled in a box furnace. The synthesized ingots were pulverized for 5 min via high energy ball milling (SPEX 8000D, SPEX) in an Ar atmosphere. The powders placed in the graphite molds were sintered using spark plasma sintering (SPS-1030, Sumitomo Coal Mining Co., Ltd.) under 10−6 Torr at 707 K for 5 min (heating rate = 100 K/min) under 70 MPa. The sintered bulk samples had relative densities of more than ~ 99%.
X-Ray diffraction (XRD, D8 Discover, Bruker) analysis was performed to analyze the crystal structure of the samples. The polycrystalline powder samples were excited with 0.154 nm wavelength Cu–Kα radiation. For the σ and S measurements, the sintered samples were processed into rectangular shapes with dimensions of 2 mm × 2 mm × 8 mm. The processed specimens were analyzed using ZEM-3 (Advanced-Riko) in the temperature range 300–520 K in a He atmosphere, and the power factor was calculated using the measured σ and S. The Hall carrier concentrations (nH) and Hall carrier mobilities (μH) were measured using a Hall measurement system (HMS5300, Ecopia) under a magnetic field of 0.548 T; the Hall measurements were performed using the van der Pauw configuration. The laser flash method (LFA457, Netzsch) was performed to obtain the thermal diffusivity (α) required to calculate κtot (κtot = α × ρs × Cp, where ρs and Cp are the sample density and heat capacity, respectively). The ρs value is the theoretical density of Bi2Te2.6Se0.4 ––assuming a linear increase in the Bi2Te3 (7.834 g/cm3)−Bi2Se3 (7.664 g/cm3) system. The Cp value of Bi2Te3 was determined from the empirical formulas of 108.06 + 5.53 × 10⁻² T J/mol·K and Cp of Bi2Se3 = 118.61 + 1.92 ×10⁻² T J/mol·K [25]. The zT value was evaluated using the calculated power factor and κtot .
3. RESULTS AND DISCUSSION
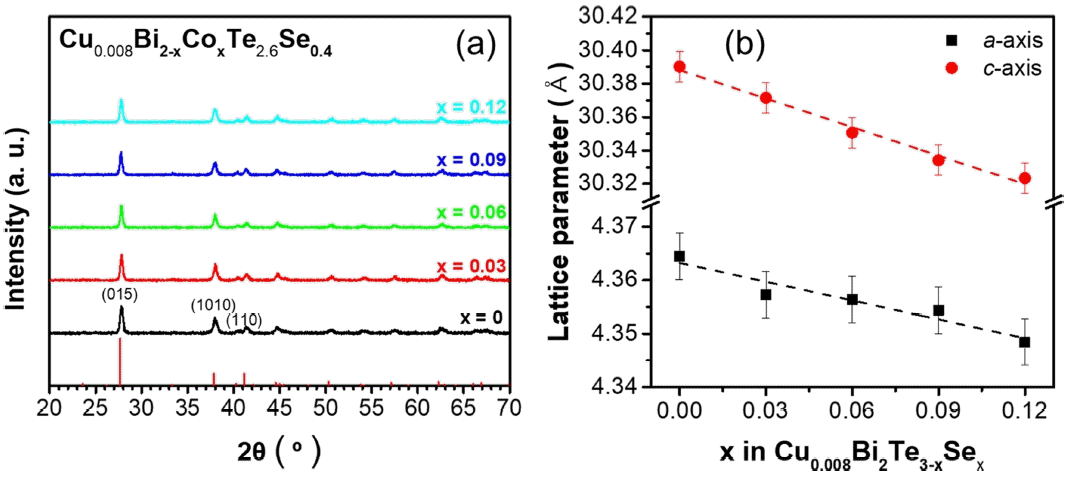
The XRD patterns for the Cu0.008Bi2−xCoxTe2.6Se0.4 powder samples indicated a single rhombohedral Bi2Te3 phase without any additional phases (Figure 1(a)). The lattice parameters, a and c were calculated using the (015) and (1010) diffraction peaks (Figure 1(b)). The calculated lattice parameters gradually decreased with an increase in x values; a decreased from 4.365 to 4.348 Å and c decreased from 30.390 to 30.323 Å. This is because Co is substituted and doped at the Bi–site, that is, a Co-cation (~ 88.5 pm) with a relatively small ionic radius replaced the Bi+3 (117 pm).

(a) XRD patterns and (b) lattice parameters of the Cu0.008Bi2−xCoxTe2.6Se0.4 (x = 0, 0.03, 0.06, 0.09 and 0.12) polycrystalline bulk alloys.
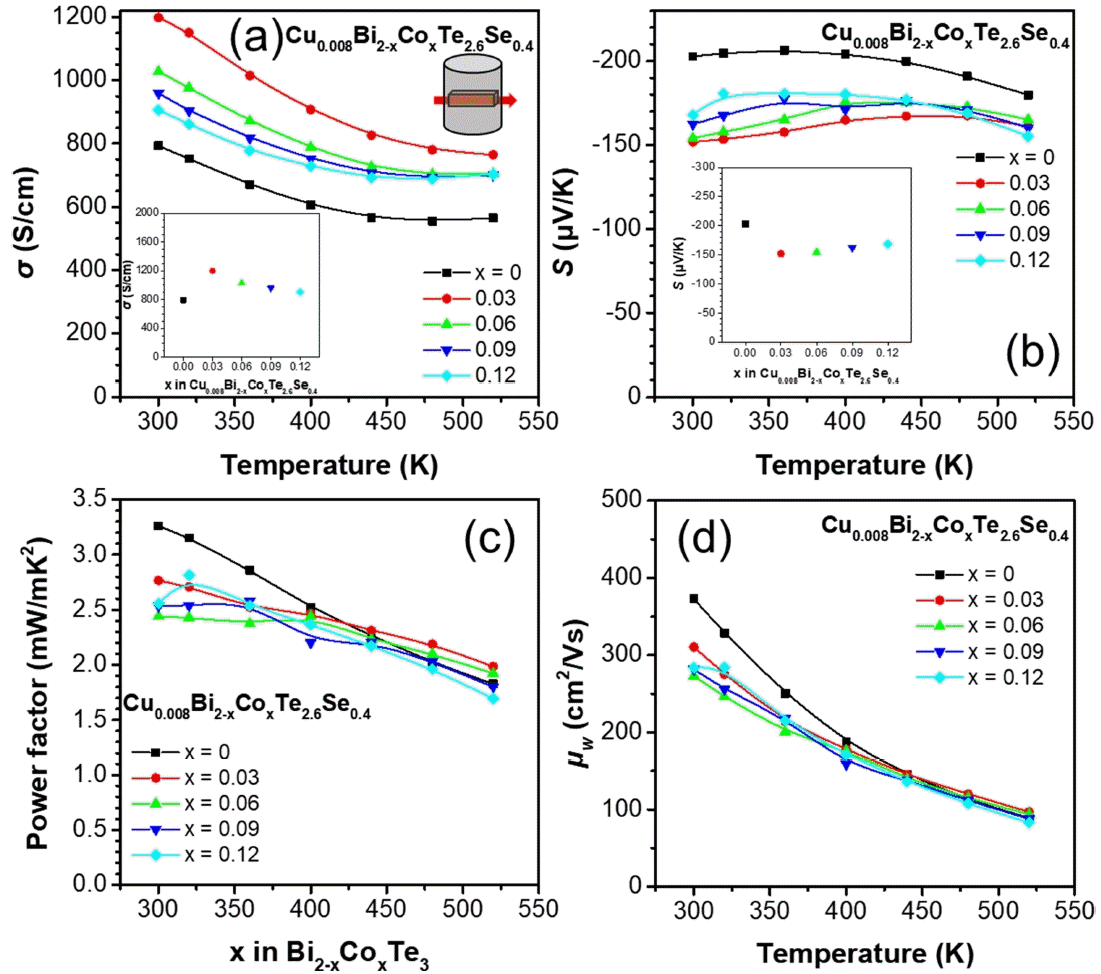
Figures 2(a) and 2(b) show σ and S as a function of temperature, respectively, for the polycrystalline bulk samples along the direction perpendicular to the sintering pressure. The σ values of the Co-doped samples were higher than those of the undoped sample at all temperature ranges, and all samples exhibited intrinsic metal behavior. As shown in the inset of Figure 2(a), the σ values for x = 0, 0.03, 0.06, 0.09, and 0.12 were 793, 1199, 1028, 960, and 906 S/cm, respectively, at 300 K. Remarkably, the σ values systemically decreased with increases in doping level, after abruptly increasing at x = 0.03. The S values were similar even with the increase in temperature with a decrease in the doped samples, owing to the trade-off relationship between σ and S. Therefore, the S values showed the opposite trend compared to σ. The S values for x = 0, 0.03, 0.06, 0.09, and 0.12 were −202, −152, −154, −163, and −168 μV/K (inset of Figure 2(b)), respectively, at 300 K.

(a) σ, (b) S, (c) power factor, and (d) μw as a function of the temperature for the Cu0.008Bi2−xCoxTe2.6Se0.4 (x = 0, 0.03, 0.06, 0.09 and 0.12) polycrystalline bulk alloys. Insets of (a) σ and (b) S as a function of x content at 300 K.
Figures 2(c) and 2(d) present the calculated power factor and weighted mobility μw as a function of temperature for the Cu0.008Bi2−xCoxTe2.6Se0.4 samples. As shown in Figure 2(c), the power factor for the samples decreased with the increase in temperature. The power factor of the doped samples decreased in the temperature range of 300–400 K compared to the undoped sample. However, after 450 K, the x = 0.03 and 0.06 samples showed a reverse trend; the power factor of the x = 0.03 sample increased by approximately 10% compared to the undoped sample at 520 K. The power factor values of the x = 0, 0.03, and 0.06 samples were 1.83, 1.99, and 1.92 mW/mK2 at 520 K, respectively. The maximum power factor was 3.26 mW/mK 2 for the x = 0 sample at 300 K. The μw value was obtained from a simple analytical form that approximates the exact Drude–Sommerfeld free-electron model given in Equation (1) for |S| > 20 μV/K [26].
where k, me, e, and h are the Boltzmann constant, mass of the electron, elementary charge, and Planck’s constant, respectively. The μw parameter infers the maximum reachable power factor when nH is optimized. The μw value of each sample was evaluated using the measured σ and S parameters; the μw values showed a similar trend as the power factor. The maximum μw value was 373 cm2/Vs for the x = 0 sample at 300 K.
Figure 3(a) shows nH as a function of x for the Cu0.008Bi2−xCoxTe2.6Se0.4 samples along the direction perpendicular to the sintering pressure. The nH values showed a trend similar to the σ values; nH increased approximately twice for the x = 0.03 (6.66 × 1019 cm−3) sample compared to the x = 0 (3.54 × 1019 cm−3 ) sample at 300 K and then decreased linearly with increases in x. The μH values for the Co-doped samples decreased because μ H is inversely proportional to nH ; however, unlike nH , the μH values were constant after x = 0.06 (Figure 3(b)). The μH values for the x = 0, 0.03, 0.06, 0.09, and 0.12 samples are 139 108, 105, 106, and 109 cm2/Vs at 300 K, respectively.

(a) nH and (b) μH (c) md* as a function of the x content for the Cu0.008Bi2−xCoxTe2.6Se0.4 (x = 0, 0.03, 0.06, 0.09 and 0.12) polycrystalline bulk alloys. Inset of (c) log10(nH) as a function of |S| at 300 K.
The magnitude of the density of states is directly related to the density-of-state effective mass md* and the electrical transport behavior was interpreted in terms of changes in the electron structure by calculating md* . Equation (2), which was optimized to a single parabolic band model, is used to plot md* for the samples (Figure 3(c)) [27].
The md* value of the x = 0.03 (1.55 m0) sample was larger than that of the x = 0 (1.529 m0) sample at 300 K because md* is proportional to both |S| and nH. This indicates that the decrease in |S| for the x = 0.03 sample is less than the increase in nH at 300 K. The inset of Figure 3(c) shows a plot of log10(nH) as a function of |S| for the samples. The md* becomes generally lower with the Co doping.
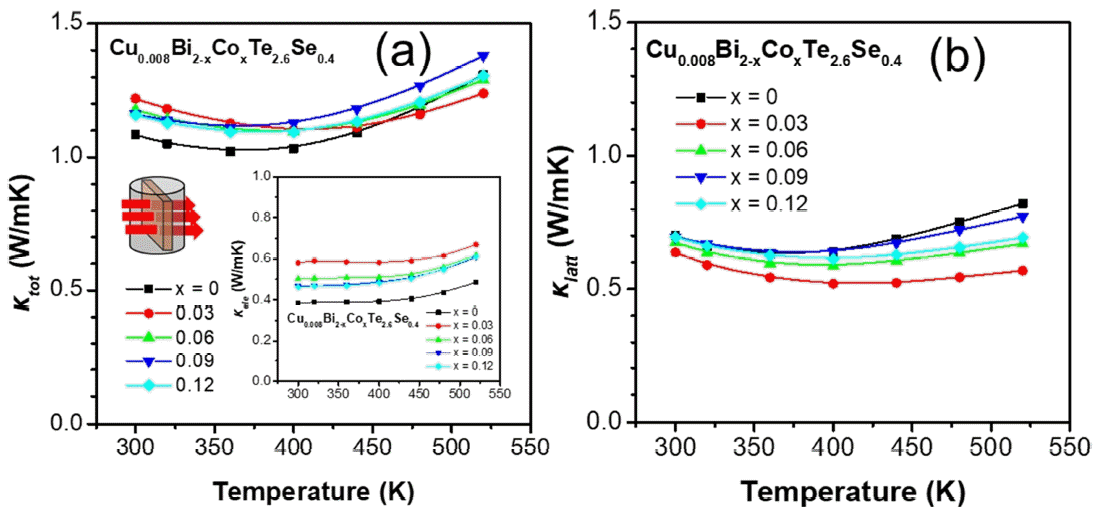
Figure 4(a) shows κtot as a function of temperature for the Cu0.008Bi2−xCoxTe2.6Se0.4 samples along the direction perpendicular to the sintering pressure. The κtot values of the x = 0.03, 0.06, 0.09, and 0.12 samples at 300–450 K increased with the increase in κele (inset of Figure 4(a)). The κele values were calculated using κele = LσT (where L is the Lorenz number [28]) and the increase in κtot significantly affected the increase in σ of the Co-doped samples. Therefore, the values of κtot for the x = 0, 0.03, 0.06, 0.09, and 0.12 samples at 300 K were 1.08, 1.22, 1.18, 1.16, and 1.16 W/mK, respectively, In contrast, the κtot values of the x = 0.03, 0.06, and 0.12 samples at 520 K decreased to 1.24, 1.29, and 1.31 W/mK, respectively, from that of the x = 0 (1.31 W/mK at 520 K) sample. Interestingly, the κ latt reached its lowest value at x = 0.03, and increased for the higher doping samples. The physical reason behind the unusual observation for κlatt may be the complex defect structures produced by the Co doping, which requires further study.

(a) κtot and (b) κlatt as a function of temperature for the Cu0.008Bi2−xCoxTe2.6Se0.4 (x = 0, 0.03, 0.06, 0.09 and 0.12) polycrystalline bulk alloys. Inset of (a) κele as a function of temperature.
Figure 5(a) illustrates the zT of the Cu0.008Bi2−xCoxTe2.6Se0.4 polycrystalline bulk samples. The thermoelectric performance of the Co-doped samples significantly decreased in contrast to the undoped sample at 300 K. The maximum zT value of the undoped sample at 300 K was 1.0. However, the zT of the undoped sample decreased above 360 K, while those of the x = 0.03 and 0.06 samples marginally increased above 450 K. Therefore, the zT values of x = 0.03 and 0.06 were enhanced more than the x = 0 sample at 480 and 520 K. The zT values of the x = 0.03, and 0.06 samples were 0.91, and 0.84 at 480 K and 0.83, and 0.77 at 520 K, respectively. Further, the zT values of the x = 0.03 and 0.06 samples were enhanced to approximately 8% and 3% at 480 K and to approximately 15% and 7% at 520 K, compared with the x = 0 (0.82 and 0.72 at 480 and 520 K, respectively), respectively.

(a) zT as a function of temperature for the Cu0.008Bi2−xCoxTe2.6Se0.4 (x = 0, 0.03, 0.06, 0.09 and 0.12) polycrystalline bulk alloys. (b) nH-dependent experimental zT (denoted using symbols) of Cu0.008Bi2−xCoxTe2.6Se0.4 (x = 0, 0.03, 0.06, 0.09, and 0.12) and calculated zT (denoted using a line) via single parabolic band model. (c) B as a function of temperature for the Cu0.008Bi2−xCoxTe2.6Se0.4 (x = 0, 0.03, 0.06, 0.09, and 0.12) polycrystalline bulk alloys.
Figure 5(b) shows the nH-dependent zT calculated via the single parabolic band model and experimental zT at 300 K; nH-dependent experimental zT (denoted using symbols) and calculated zT (denoted using a line), which indicates the theoretically achievable zT at 300 K. The zT values of all the Co-doped samples were lower than the achievable zT (line in Figure 5(b)), which would infer the band structure was unfavorably changed by the doping. Because the nH value of the x = 0.03 sample was the highest, it is plotted at the rightmost side (nH of 6.7 ×1019 cm−3) in the graph (solid red). As the doping content increases, the symbols shift toward the left, which indicates a decrease in nH . However, the peak value of the calculated zT was observed when nH was 2.2 × 1019 cm−3 . Therefore, nH optimization of the samples is required. Based on the calculation, shown in Fig 5(b), zT can be increased to 0.94 at 300 K when nH is optimized (decreased) to ~ 2.2 × 1019 cm−3 . Dopants to decrease the mother compound Cu0.008Bi2Te2.6Se0.4 could be introduced to enhance zT at 300 K.
Figure 5(c) shows the dimensionless thermoelectric quality factor B, which was evaluated using Equation (3) [26]:
Based on previous studies, B is proportional to the maximum zT value that can be achieved for an optimized nH [29, 30]. Therefore, the general trend of B is similar to that of zT; however, in this study, the x=0.03 sample has a maximum B value (0.49) at 440 K. In particular, the B values for all doped samples above 480 K were less than that of the undoped sample. The B values of the x = 0, 0.03, 0.06, 0.09, and 0.12 samples were 0.29, 0.45, 0.37, 0.30, and 0.32, respectively, at 520 K. This indicates that in the Co-doped samples at 520 K, zT can be increased to a greater extent, when nH is optimized.
4. CONCLUSIONS
In summary, the thermoelectric properties of Co-doped Bi2Te2.6Se0.4, Cu0.008Bi2−xCoxTe2.6Se0.4 (x = 0, 0.03, 0.06, 0.09, and 0.12) polycrystalline samples were investigated. The electrical conductivity generally increased for the Co-doped samples and the S values decreased. The measured power factor of the Co-doped samples was lower than 3.26 mW/mK2 for the pristine Cu0.008Bi2Te2.6Se0.4 sample at 300 K. However, the power factor of the Cu0.008Bi1.97Co0.03Te2.6Se0.4 (x = 0.03) sample became higher at 520 K. A decrease in lattice thermal conductivity was observed for the Co-doped samples due to additional point defect phonon scattering. Consequently, a maximum zT of 1.0 was observed for the x = 0 sample at 300 K; however, above 440 K, the zT values of the x = 0.03 and 0.06 samples were approximately 15% and 7% larger than that of the x = 0 sample, at 520 K, respectively. Furthermore, a maximum quality factor of 0.49 was observed for the x = 0.03 sample at 440 K, which would infer that the highest zT can be obtained with the x = 0.03 sample at 440 K by optimizing carrier concentration.
Notes
There is no conflict of interest.
Acknowledgements
This study was supported by the National Research Foundation of Korea (NRF-2019R1C1C1005254 and NRF2022R1F1A1063054).