Improved Thermoelectric Performance of Cu3Sb1−x−ySnxInySe4 Permingeatites Double-Doped with Sn and In
Article information
Abstract
Cu–Sb–Se ternary chalcogenide compounds composed of earth-abundant low-toxicity elements are attracting attention as economical and ecofriendly semiconductors. Among them, permingeatite (Cu3SbSe4) is a potential thermoelectric material with high Seebeck coefficient and low lattice thermal conductivity. However, it is necessary to improve its thermoelectric properties through doping, as it has low electrical conductivity due to its low intrinsic carrier concentration. In this study, samples of Cu3Sb1−x−ySnxInySe4 (0.02 ≤ x ≤ 0.08 and 0.04 ≤ y ≤ 0.06) double-doped with In (group 13 element) and Sn (group 14 element) at the Sb (group 15 element) sites of permingeatite were synthesized and their thermoelectric performances were evaluated. All samples exhibited a single phase of permingeatite with tetragonal structure, and high relative densities of 97.4–98.9%. The lattice constants of the a- and c-axes were 0.5651–0.5654 and 1.1249–1.1257 nm, respectively, owing to the successful substitution of Sn and In at the Sb sites. As the doping concentrations of Sn and In increased, the carrier (hole) concentration increased. Thus, the Seebeck coefficient decreased, while the electrical and thermal conductivities increased. Sn doping was found to be more effective than In doping. Because Cu3Sb0.96−xSnxIn0.04Se4 exhibits higher Seebeck coefficients than Cu3Sb0.94−xSnxIn0.06Se4, larger power factors and higher dimensionless figures of merit (ZTs) were achieved for the Cu3Sb0.96−xSnxIn0.04Se4 specimens. Cu3Sb0.92Sn0.04In0.04Se4 achieved a maximum ZT of 0.59 at 623 K, based on its Seebeck coefficient of 161 µVK−1, electrical conductivity of 4.69 × 10⁴ Sm−1, thermal conductivity of 0.77 Wm−1K−1, and power factor of 1.22 mWm−1K−2.
1. INTRODUCTION
The depletion of natural energy resources has increased interest in thermoelectric power generation technology which can generate electricity from waste heat [1-3]. The energyconversion efficiency of thermoelectric power generation is determined by a dimensionless figure of merit (ZT), which depends on material factors (Seebeck coefficient: α, electrical conductivity: σ, and thermal conductivity: к) and operating temperature (absolute temperature: T) [4-7]:
Accordingly, a high ZT value can be obtained by increasing the power factor (α2σ) and/or reducing the thermal conductivity [8,9]. The Seebeck coefficient can be increased by adopting a large effective mass or a complex energy-band structure, and the concentration and mobility of charge carriers should be increased to increase the electrical conductivity. However, because the Seebeck coefficient decreases when the charge-carrier concentration is increased, the power factor can be maximized by optimizing the carrier concentration. Methods of reducing the thermal conductivity include using a large unit cell, reducing the mean free path of phonons, and increasing phonon scattering using impurities. However, because the Seebeck coefficient, electrical conductivity, and thermal conductivity are all dependent on the carrier concentration, it is difficult to optimize them simultaneously [1,7].
Cu3SbSe4 (permingeatite) has a deformed zinc-blende structure belonging to the space group I
Various studies have been conducted on improving the thermoelectric performance by substituting group 13 (BIII), 14 (BIV), and 15 (BV) elements for Sb, which is a group 15 (BV) element. Zhao et al. [16] obtained ZT = 0.54 at 650 K for Cu3Sb0.985Ga0.015Se4, and Zhang et al. [17] achieved ZT = 0.50 at 648 K for Cu3Sb0.997In0.003Se4. Wei et al. [18] reported ZT = 0.70 at 673 K for Cu3Sb0.98Sn0.02Se4. Pi et al. [14] obtained ZT = 0.65 at 623 K for Cu3Sb0.86Ge0.14Se4, and Chang et al. [19] achieved ZT = 0.70 at 640 K for Cu2.95Sb0.96Ge0.04Se4. Liu et al. [20] reported ZT = 0.81 at 648 K for Cu3Sb0.98Bi0.02Se4.
Mechanical alloying (MA) is a high-energy ball-milling process performed at room temperature, which can prevent volatilization and segregation of the chalcogen elements generated during melting. It is a practical and economical solid-state synthesis process with relatively low energy and processing time. Therefore, in this study, permingeatite powders of Cu3Sb1−x−ySnxInySe4 double-doped with Sn and In were synthesized using MA, and sintered using hot pressing (HP). Sn4+ and In3+ have fewer electrons than Sb5+; thus, a possible p-type dopant (acceptor) can be expected in Cu3SbSe4. The changes in the thermoelectric properties according to the doping level are examined.
2. EXPERIMENTAL
To synthesize Sn/In double-doped Cu3Sb1−x−ySnxInySe4 (x = 0.02, 0.04, 0.06, 0.08, and y = 0.04, 0.06) permingeatites, elemental powders of Cu (purity 99.9%, <45 μm), Sb (purity 99.999%, <150 μm), Sn (purity 99.999%, <35 μm), In (purity 99.999%, <75 μm), and Se (purity 99.9%, <10 μm) were used. Mixed raw-material powders (20 g) and stainless-steel balls (400 g) were placed in a hardened steel jar, and MA was performed in Ar atmosphere at 350 rpm for 12 h. HP was conducted on the synthesized powders using a graphite mold and punches, under a uniaxial pressure of 70 MPa at 573 K for 2 h in vacuum.
The phases of the sintered specimens were analyzed using X-ray diffraction (XRD; Bruker, D8-Advance) with Cu Kα radiation. To calculate the lattice constant, Rietveld refinement (TOPAS program) was performed. The microstructures of the sintered specimens were observed using scanning electron microscopy (SEM; FEI, Quanta400) in backscattered electron (BSE) mode, and elemental line scans and maps were analyzed according to the energy level of each element, using an energy-dispersive X-ray spectrometer (EDS; Bruker, XFlash4010). The carrier concentration and mobility were evaluated by measuring the Hall coefficient using the van der Pauw method (Keithley 7065). The Seebeck coefficient and electrical conductivity were measured in He atmosphere using a ZEM-3 system (Advance Riko). The thermal diffusivity was measured in vacuum by the laser flash method using TC-9000H equipment (Advance Riko), and the thermal conductivity was evaluated from the specific heat and density. From the Seebeck coefficient, electrical conductivity, and thermal conductivity, the temperature dependence of the thermoelectric power factor and ZT values were examined in the temperature range of 323–623 K.
3. RESULTS AND DISCUSSION
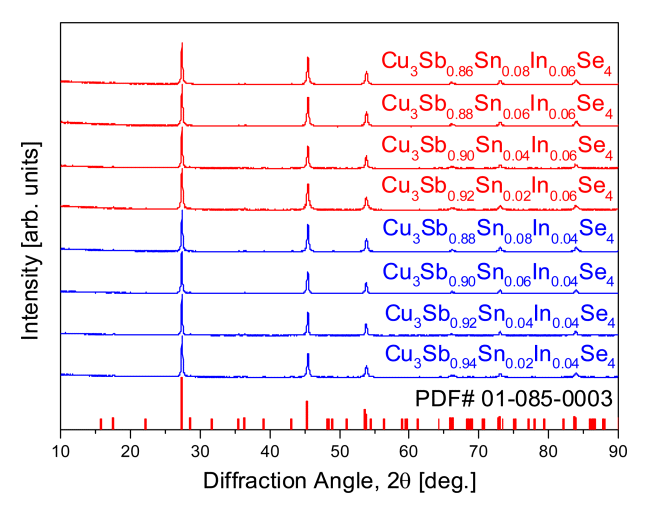
Figure 1 shows the XRD patterns of Cu3Sb1−x−ySnxInySe4 prepared by the MA–HP method. All diffraction peaks correspond to a single phase tetragonal structure, consistent with the standard diffraction pattern for permingeatite (ICDD PDF# 01-085-0003). This means that no phase transitions or decompositions occur, and no secondary phases are detected after HP at 573 K. Rietveld analysis was performed to determine the changes in the lattice constant due to Sn and In doping (substitution), and Table 1 summarizes the estimated lattice constants. The lattice constants of pure Cu3SbSe4 have been reported to be a = 0.5649 nm and c = 1.1247 nm [14,21]. In this study, the double doping of Sn and In increases the a-axis to 0.5651–0.5654 nm and c-axis to 1.1249–1.1257 nm. This implies that Sn and In have been successfully substituted at the Sb sites; however, the change in the lattice constant, according to the change in the doping amount, is not significant. Shannon [22] reported that the ionic radii were 76 pm for Sb5+, 74 pm for Sn4+, and 80 pm for In3+. Wei et al. [18] observed that there were no diffraction peak shifts, even at high diffraction angles, owing to the small difference between the ionic radii of Sn4+ and Sb5+. Ghanwat et al. [23] reported that the a-axis increased from 0.56603 to 0.56607–0.56636 nm and c-axis from 1.12843 to 1.12848–1.12876 nm, following In doping.
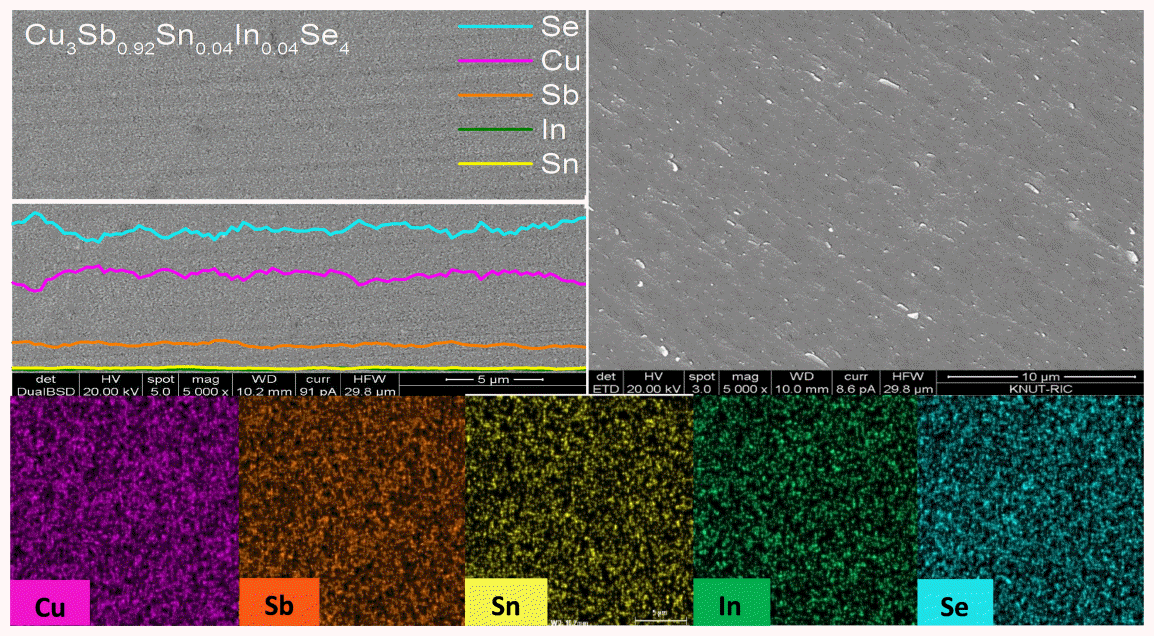
Figure 2 presents the BSE–SEM images of Cu3Sb0.92Sn0.04In0.04Se4 (upper left: polished surface and upper right: fractured surface) with elemental line scans and maps. As shown in Table 1, high relative densities of 97.4–98.9% are obtained. Densely sintered microstructures without pores or cracks are observed, and no secondary phases other than the permingeatite phase are identified. This is consistent with the results of the XRD analysis shown in Figure 1. The EDS elemental analysis confirms that all the constituent elements are uniformly distributed.
The charge-transport parameters of Cu3Sb1−x−ySnxInySe4 are shown in Table 1. The undoped Cu3SbSe4 has a carrier concentration of 5.2 × 1018 cm−3 and mobility of 49.9 cm2V−1s−1 [14]. In this study, as the doping levels of Sn and In increase, the carrier concentration increases to 1.46 × 1019 cm−3 for Cu3Sn0.88Sn0.08In0.04Se4 and 1.87 × 1019 cm−3 for Cu3Sb0.86Sn0.08In0.06Se4. In addition, the mobility increases to 517–2,352 cm2V−1s−1 through Sn/In double doping. Wei et al. [18] found that the carrier concentration increased while the mobility decreased upon increasing the Sn doping level in Cu3Sb1−xSnxSe4, and reported that Cu3Sb0.96Sn0.04Se4 exhibited a carrier concentration of (2.0–2.5) × 1020 cm−3 and mobility of (15–27) cm2V−1s−1 at 300–673 K. Zhang et al. [17] obtained a carrier concentration of 2.2 × 1018 cm−3 and mobility of 65 cm2V−1s−1 for Cu3SbSe4 and reported that, as the In-doping content increased in Cu3Sb1−yInySe4, the carrier concentration increased to a maximum of 3.5 × 1019 cm−3 and the mobility became 10 cm2V−1s−1, for Cu3Sb0.996In0.004Se4. Liu et al. [20] reported that the carrier concentration increased as the Sn content increased in Cu3Sb1−x−ySnxBiySe4, but it decreased as the Bi content increased, and reached 1.0 × 1020 cm−3 for Cu3Sn0.88Sn0.10Bi0.02Se4. Kumar et al. [24] reported that, as the Bi content increased in Cu3Sb1−xBixSe3.99Te0.01, the carrier concentration increased until Cu3Sb0.92Bi0.08Se3.99Te0.01 exhibited a carrier concentration of 9.62 × 1018 cm−3.
In general, in nondegenerate semiconductors, as the carrier concentration increases, the mobility decreases [25]. However, in this study, the mobility tended to increase as the carrier concentration increased. This is attributed to the transition from the nondegenerate state to the degenerate state, through the double doping of Sn and In. Suzumura et al. [26] found that, in the case of degenerate semiconductors, both the carrier concentration and mobility could be increased by doping.
The thermoelectric properties were measured for eight types of Cu3Sb1−x−ySnxInySe4−based specimens prepared in this study, and are shown in Table 1 and Figure 1. However, in this study, the thermoelectric properties of Cu3Sb0.92Sn0.04In0.04Se4, Cu3Sb0.90Sn0.06In0.04Se4, Cu3Sb0.92Sn0.02In0.06Se4, and Cu3Sn0.88Sn0.06In0.06Se4 were compared as representatives. Figure 3 shows the electrical conductivity of Cu3Sb1−x−ySnxInySe4. All specimens showed negative temperature dependence, such as degenerate semiconductor behavior, decreasing the electrical conductivity upon increasing the temperature. As the Sn and In doping concentrations increase at a constant temperature, the electrical conductivity increases and the Sn doping effect becomes dominant. When Sn4+ and In3+ are substituted at the Sb5+ sites of Cu3SbSe4, additional charge carriers (holes) are created, resulting in increased electrical conductivity. Cu3Sb0.90Sn0.06In0.04Se4 exhibits the highest electrical conductivity of (0.9–0.6) × 105 Sm−1 at 323–623 K. Wei et al. [18] found that the electrical resistivity decreased (the electrical conductivity increased) as the Sn content increased in Cu3Sb1−xSnxSe4 and obtained the highest electrical conductivity of (0.2–0.5) × 105 Sm−1 at 300–650 K for Cu3Sb0.96Sn0.04Se4. Zhang et al. [17] reported that the electrical conductivity increased as the In content increased in Cu3Sb1−yInySe4, and achieved the highest electrical conductivity of (0.6–0.9) × 104 Sm−1 at 300–650 K for Cu3Sb0.996In0.004Se4.
Liu et al. [20] found that the electrical conductivity of Cu3Sb1−x−ySnxBiySe4 increased as the Sn content increased and Bi content decreased, exhibiting degenerate semiconductor behavior, decreasing with increasing temperature. They obtained the highest electrical conductivity of 0.5 × 10⁵ Sm−1 at 300 K for Cu3Sn0.88Sn0.10Bi0.02Se4. They reported anomalously high values for the Sn/Bi-double-doped samples, which were even higher than those of the Sn single-doped samples. However, Kumar et al. [24] found that Cu3Sb1−xBixSe3.99Te0.01 exhibited typical nondegenerate semiconductor behavior, in which the electrical conductivity increased as the Bi content and temperature increased, and obtained the highest electrical conductivity of 0.3 × 10⁵ Sm−1 at 650 K for Cu3Sb0.92Bi0.08Se3.99Te0.01. Zhao et al. [27] reported that the electrical conductivity increased upon increasing the Ag content in Cu3(1−x)Ag3xSb0.985Bi0.015Se4, and Cu2.79Ag0.21Sb0.985Bi0.015Se4 exhibited the highest electrical conductivity of 0.8 × 10⁴ Sm−1 at 623 K. This value was greater than that of the Bi-doped samples.
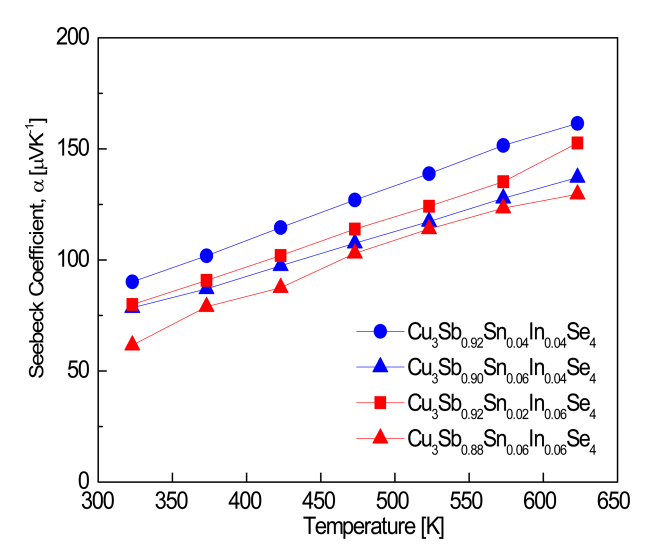
Figure 4 shows the Seebeck coefficients of Cu3Sb1−x−ySnxInySe4. All specimens exhibited positive values in the measured temperature range, which confirmed that the majority of carriers were holes of the p-type semiconductors [7]. Because the Seebeck coefficient is inversely proportional to the carrier concentration, as the Sn and In doping content increases, the Seebeck coefficient decreases. As the temperature increases, the Seebeck coefficient gradually increases; thus, intrinsic conduction does not occur within the measured temperature range.
Cu3Sb0.92Sn0.04In0.04Se4 exhibited the highest Seebeck coefficient of 90–161 μVK−1 at 323–623 K. Wei et al. [18] reported that the Seebeck coefficient decreased as the Sn content increased in Cu3Sb1−xSnxSe4, and obtained 90–170 μVK−1 at 300–673 K for Cu3Sb0.96Sn0.04Se4. Zhang et al. [17] observed intrinsic conduction (degenerate state) in Cu3Sb1−yInySe4 at temperatures above 475 K, and achieved 210–290 μVK−1 at 300–650 K for Cu3Sb0.996In0.004Se4. Liu et al. [20] reported that, in Sn/Bi-double-doped Cu3Sb1−x−ySnxBiySe4, the Seebeck coefficient decreased as the Sn content increased, while it increased with the addition of Bi, reaching 150–255 μVK−1 at 327–673 K for Cu3Sb0.96Sn0.02Bi0.02Se4. Kumar et al. [24] found that, in Bi/Te double-doped Cu3Sb1−xBixSe3.99Te0.01, the Seebeck coefficient decreased as the Bi content increased, and Cu3Sb0.98Bi0.02Se3.99Te0.01 exhibited the highest Seebeck coefficient of 180–320 μVK−1 at 300–650 K. Zhao et al. [27] also found that the Seebeck coefficient decreased when Bi was singly doped in Cu3Sb0.985Bi0.015Se4, but it increased when Bi and Ag were double-doped, resulting in the highest Seebeck coefficient of 460 μVK−1 at 423 K for Cu2.79Ag0.21Sb0.985Bi0.015Se4.
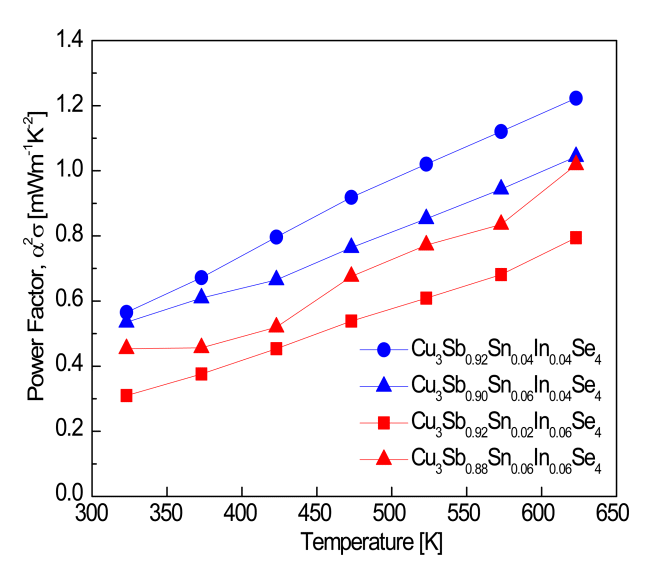
Figure 5 shows the power factor of Cu3Sb1−x−ySnxInySe4. According to the results of our previous studies [14,21], the power factor of Cu3SbSe4 was as small as 0.39–0.49 mWm−1K−2 at 323–623 K, and its temperature dependence was relatively low. However, in this study, Sn/In double doping rapidly increases the power factor upon increasing the temperature, and thus, Cu3Sb0.92Sn0.04In0.04Se4 exhibited a maximum power factor of 1.20 mWm−1K−2 at 623 K. Wei et al. [18] reported 0.91 mWm−1K−2 at 673 K for Cu3Sb0.98Sn0.02Se4, and Zhang et al. [17] obtained 0.75 mWm−1K−2 at 648 K for Cu3Sb0.998In0.002Se4. Liu et al. [20] reported 1.14 mWm−1K−2 at 673 K for Cu3Sb0.98Sn0.02Se4 and 0.77 mWm−1K−2 at 608 K for Cu3Sb0.98Bi0.02Se4. In addition, they achieved an anomalously high power factor of 1.81 mWm−1K−2 at 673 K for the Sn/Bi-double-doped Cu3Sn0.88Sn0.10Bi0.02Se4. Kumar et al. [24] also obtained a high power factor of 1.3 mWm−1K−2 at 375 K for the Bi/Te-double-doped Cu3Sb0.98Bi0.02Se3.99Te0.01. Zhao et al. [27] reported that the power factor increased upon increasing Ag content in Cu3(1−x)Ag3xSb0.985Bi0.015Se4, resulting in (1.0–1.2) mWm−1K−2 at 300–623 K for Cu2.79Ag0.21Sb0.985Bi0.015Se4.
Figure 6 presents the thermal conductivity of Cu3Sb1−x−ySnxInySe4 and distinguishes the contributions of lattice thermal conductivity (кL) and electronic thermal conductivity (кE). The thermal conductivity is determined by these two components: the thermal conductivity of phonons and that of carriers [28,29]. As shown in Figure 6(a), the thermal conductivity decreases as the temperature increases from 323 to 623 K. Cu3Sb0.92Sn0.02In0.06Se4 exhibits a minimum thermal conductivity of 1.19 Wm−1K−1 at 623 K. As shown in Figure 6(b), as the temperature increases, the lattice thermal conductivity decreases, and the lattice thermal conductivity is dominant over the total thermal conductivity (Figure 6 (a)). Cu3Sb0.92Sn0.04In0.04Se4 exhibited a minimum кL of 0.77 Wm−1K−1 at 623 K. As shown in Figure 6(c), there is little temperature dependence for the electronic thermal conductivity, but the electronic thermal conductivity changed with the doping levels because the carrier concentration changes with the Sn and In content. The electronic thermal conductivity is expressed by the Wiedemann–Franz law:.
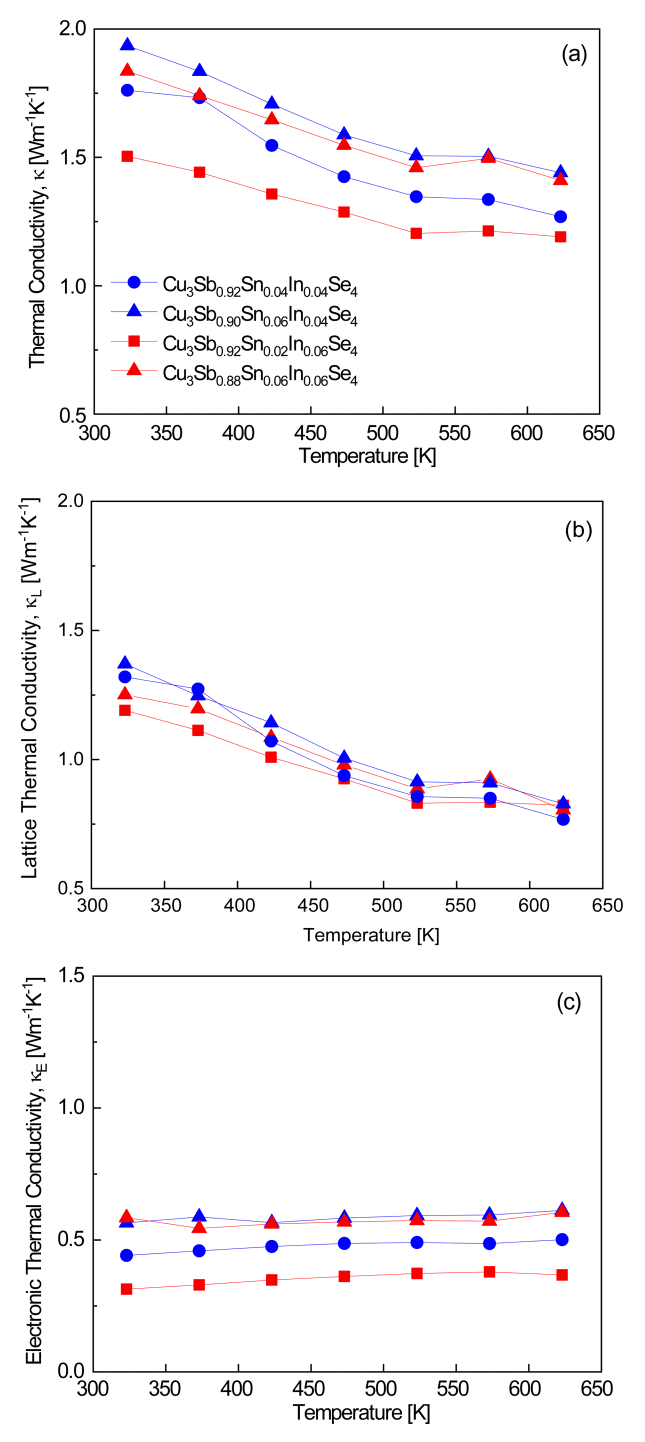
Thermal conductivity of Cu3Sb1−x−ySnxInySe4; (a) total thermal conductivity, (b) lattice thermal conductivity, and (c) electronic thermal conductivity.
where L is the temperature-dependent Lorenz number [30,31], which was calculated and is presented in Table 1. As the carrier concentration is increased by the Sn and In double doping, Cu3Sb0.92Sn0.02In0.06Se4 exhibited a minimum кE of 0.31 Wm−1K−1 at 623 K.
Wei et al. [18] found that the lattice thermal conductivity in Cu3Sb1−xSnxSe4 decreased with T−1 in the temperature range of 300–673 K, indicating that the Umklapp scattering was predominant in phonon transport; the thermal conductivity increased as the Sn content increased, reaching 2.0–3.6 Wm−1K−1 at 300–673 K for Cu3Sb0.96Sn0.04Se4. Zhang et al. [17] reported that the thermal conductivity of Cu3Sb1−xInxSe4 decreased with increasing temperature (300–650 K), which was associated with a decrease in lattice thermal conductivity due to the increased point-defect scattering. According to Cahill's formula, the minimum кL was estimated to be 0.8 Wm−1K−1 at 650 K for Cu3Sb0.997In0.003Se4, and the experimentally obtained minimum кL was 0.5 Wm−1K−1 at 648 K for Cu3Sb0.997In0.003Se4.
Liu et al. [20] achieved a low кL, owing to the increased point-defect density and lattice distortion caused by the incorporation of Sn and Bi, and as a result, low thermal conductivity values were reported: 0.9–2.1 Wm−1K−1 at 327–673 K for Cu3Sb0.90Sn0.10Se4, 0.6–1.0 Wm−1K−1 at 327–648 K for Cu3Sb0.98Bi0.02Se4, and 0.8–1.2 Wm−1K−1 at 327–673 K for Cu3Sb0.96Sn0.02Bi0.02Se4. Kumar et al. [24] found that the thermal conductivity of Cu3Sb1−xBixSe3.99Te0.01 decreased as the temperature and Bi content increased, owing to an increase in the phonon scattering. As a result, Cu3Sb0.98Bi0.02Se3.99Te0.01 exhibited a minimum thermal conductivity of 0.7–1.5 Wm−1K−1 at 300–650 K. Zhao et al. [27] reported that the thermal conductivity of Cu3(1−x)Ag3xSb0.985Bi0.015Se4 decreased with increasing temperature, and Cu2.85Ag0.15Sb0.985Bi0.015Se4 exhibited a minimum thermal conductivity of 0.7 Wm−1K−1 (кL = 0.6 Wm−1K−1) at 673 K.
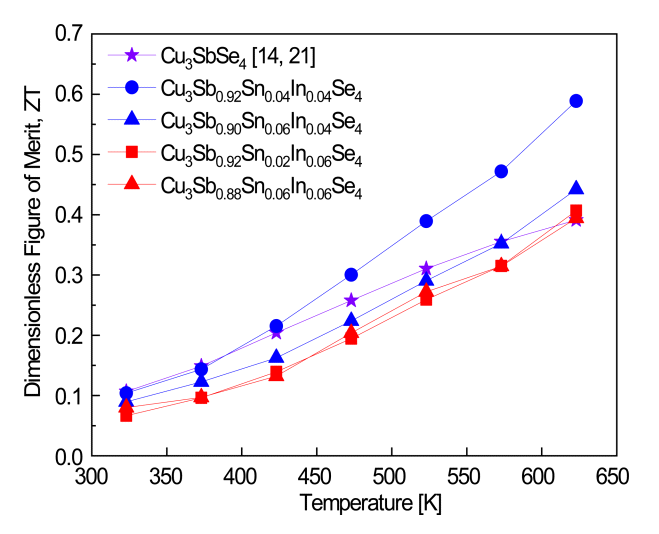
Figure 7 shows the dimensionless figure of merit (ZT) of Cu3Sb1−x−ySnxInySe4. In our previous studies [14,21], undoped Cu3SbSe4 exhibited a maximum ZT of 0.39 at 623 K. In comparison, the ZT values of Cu3Sb0.92Sn0.04In0.04Se4 were higher than those of Cu3SbSe4, particularly at high temperatures, and we achieved a maximum ZT of 0.59 at 623 K. The Cu3Sb0.96−xSnxIn0.04Se4 specimens exhibited higher ZT values than Cu3Sb0.94−xSnxIn0.06Se4, because of their higher Seebeck coefficients and power factors.
Wei et al. [18] reported a ZT of 0.70 at 673 K for Cu2.95Sb0.98Sn0.02Se4 fabricated by MA and spark plasma sintering. Zhang et al. [17] obtained a ZT of 0.50 at 648 K for Cu3Sb0.997In0.003Se4 prepared through a multistep process (conventional melting, quenching, hand grinding, annealing, pulverizing, and HP), which was 47% higher than the ZT value of Cu3SbSe4. Liu et al. [20] reported a ZT of 1.26 at 673 K for Cu3Sn0.88Sn0.10Bi0.02Se4 nanocrystals produced by solution processing followed by HP. Kumar et al. [24] achieved a ZT of 0.76 at 650 K for Bi/Te double-doped Cu3Sb0.98Bi0.02Se3.99Te0.01 fabricated by melt growth, ball milling, and spark plasma sintering. Zhao et al. [27] reported a ZT of 0.51 at 673 K for Ag/Bi-double-doped Cu2.85Ag0.15Sb0.985Bi0.015Se4 prepared by vacuum melting, quenching, annealing, pulverizing, and HP.
This study determined that the double doping of Sn and In is effective for improving the thermoelectric performance of permingeatite. In addition, the solid-state synthesis process involving MA and HP is a simple and practical one that does not require subsequent crushing and/or heat-treatment to produce doped permingeatite compounds. Further improvement in the thermoelectric performance can be expected through detailed study of the combinations and portions of the double-doping elements, and doping sites.
4. CONCLUSIONS
In this study, we prepared double-doped Cu3Sb1−x−ySnxInySe4 (x = 0.02–0.08, y = 0.04–0.06) permingeatites using MA followed by HP. We investigated the effects of double doping (partial substitution) of Sn and In at the Sb sites on the phase change, microstructure, charge transport, and thermoelectric properties. A single phase of permingeatite with a tetragonal structure was produced without post-annealing treatment, and a high relative density was obtained for the HP specimens. All the doped samples exhibited positive Seebeck and Hall coefficients, indicating p-type conduction characteristics. Double doping with Sn and In significantly increased the power factor, and thus Cu3Sb0.92Sn0.04In0.04Se4 exhibited a maximum power factor of 1.20 mWm−1K−2 at 623 K. However, Cu3Sb0.92Sn0.02In0.06Se4 exhibited a minimum thermal conductivity of 1.19 Wm−1K−1 at 623 K. As a result, Cu3Sb0.92Sn0.04In0.04Se4 reached a maximum ZT value of 0.59 at 623 K, which was more than a 50% improvement over the ZT value of undoped permingeatite.
Acknowledgements
This study was supported by the Basic Science Research Capacity Enhancement Project (National Research Facilities and Equipment Center) of the Korea Basic Science Institute funded by the Ministry of Education (Grant No. 2019R1A6C1010047).
