1. INTRODUCTION
Martensitic stainless steel (MSS) is widely known and used in various industrial applications, such as steam generators, pressure vessels, mixer blades, cutting tools, and offshore platforms for oil extraction. This steel is commonly used to manufacture components for high- and low-temperature applications because of its excellent mechanical properties and reasonable corrosion resistance [1–3]. Among MSSs, American Iron and Steel Institute (AISI) 420 is a lowchromium MSS that is commercially available in low-carbon (carbon content less than 0.15%) and medium-carbon forms (maximum carbon content of 0.5%) [4,5].
The microstructures of AISI 420 MSS are typically modified by various heat treatments for numerous industrial applications [6,7]. Generally, AISI 420 MSS exists commercially in an untampered state, which is extremely hard and brittle. The strength and wear resistance levels of AISI 420 MSS can be improved through tempering [4]. This steel is normally subjected to an initial hardening treatment prior to tempering. This treatment involves the transformation of the steel matrix into austenite at a specific temperature, followed by rapid quenching at a high cooling rate to obtain a complete martensitic structure [8,9]. Consequently, tempering is performed to relieve the residual stresses associated with the martensitic transformation to improve the toughness and formability of the steel [10,11]. This approach was reported by Tavares et al. [12], who indicated that steel tempering can be achieved at temperatures ranging from 200–700 °C. However, scholars generally do not recommend tempering in the range of 400–600 °C, as this process decreases impact toughness and corrosion resistance.
Furthermore, even though strength and toughness are important properties to consider when managing AISI 420 MSS, this steel is subjected to cyclic loading in most industrial applications. AISI 420 MSS experiences fracture due to repeated loading, predominantly under dynamic and cyclic loading conditions. This tendency to fracture leads to early fatigue failure and limits the widespread applicability of this steel [13]. Fatigue failure occurs in three stages: crack initiation, crack propagation, and ultimate fracture. The crack initiates with high shear stress at the surface and gradually propagates throughout the material once it reaches a certain crack growth length. Subsequently, permanent failure occurs during the final loading cycle [14]. Fatigue cracks usually occur on the surfaces of specimens, however, for high-cycle fatigue, cracks can initiate inside the material [15]. Reportedly, the fatigue failure of most metallic components depends significantly on the distribution of residual stress within the microstructure [16].
Overall, we aim to provide valuable insights into the variations in the microstructure of AISI 420 MSS plate with respect to its grain orientation and the influence of temperature on its mechanical strength. The mechanical properties at different temperatures along the rolling direction (RD) are investigated. Additionally, we aim to comprehensively study the fatigue properties of the plate and understand the mechanisms by which the degree of deformation resulting from the fatigue cycle affects its microstructure. The findings of this study can aid in improving the performance and reliability levels of MSS plates in various industrial applications.
2. EXPERIMENT
2.1. Chemical composition of the plate
Table 1 shows the chemical composition of the AISI 420 MSS used in this study. The MSS plate was processed by annealing treatment after cold rolling to the required thickness of 0.152 mm.
2.2 Evaluation of the microstructure and tensile properties
The microstructure of the AISI 420 MSS plate was observed using a field emission scanning electron microscope (FE-SEM; JSM-7100 F, JEOL, USA) equipped with an electron backscatter diffractometer (EBSD; TSL Hikari Super, TSL, USA). The plate was first mechanically polished and then chemically polished using colloidal silica until a mirror-like surface was achieved before the analysis. The orientation of each pixel was calculated from the measured Kikuchi diffraction patterns, and the patterns with average confidence index (CI) values of at least 0.8 were postprocessed using EBSD software (TSL OIM Analysis V8, TSL, USA).
To analyze the mechanical properties of the AISI 420 MSS plates, tensile tests were conducted using a high-temperature fatigue tester (MTS 810, MTS, USA) on a test specimen. The shape and dimensions of the tensile specimen are shown in Fig 1, with a gauge length of 17 mm and a width of 4 mm. This specimen was tailored to accommodate the specific characteristics of the AISI MSS plate employed in this study, which possesses a slim thickness of 0.152 mm. Tensile specimens were initially sectioned out of the plate along the RD and transverse direction (TD). The temperature used during the tests was varied from room temperature to 200 °C, which is within the operating temperature range of the plate, to examine the effects of temperature on the tensile strength, yield strength, elastic modulus, and elongation of the specimen. The strain rate of the testing machine was set to 0.015/min before the yield point and 0.05/min after the yield point, referring to ASTM E8/E8M-15a [17]. Subsequently, the temperatures of the specimens were measured by direct contact using a thermocouple.
2.3 Evaluation of the fatigue properties
The fatigue testing in this study was conducted using a high-temperature fatigue tester (MTS 810, MTS, USA) with a stress ratio (R) of 0.1 and a test frequency of 10 Hz. The high-cycle fatigue test was conducted at room temperature, and subsequently, the microstructure at each stress level was further analyzed by controlling the fatigue cycles within the same stress range. The shape and dimensions of the fatigue test specimen are shown in Fig 2. Like the tensile specimens, they were specifically tailored due to the slender dimensions.
3. RESULTS AND DISCUSSION
3.1 Analysis of the microstructure and tensile properties of the plate
Figure 3 shows the microstructural features of the AISI 420 MSS plate. The average grain size was approximately 1.9 ± 1.05 μm (Fig 3(a)). The grain boundary distributions are shown in Fig 3(b), with the proportions of low-angle grain boundaries (LAGBs; 2° ≤ q ≤ 15°) and high-angle grain boundaries (HAGBs; q >15o) being 16.6% and 83.4%, respectively. In addition, the grain orientation spread (GOS) distribution map, indicating the degree of recrystallization in the AISI 420 MSS plate, is presented in Fig 3(c). The blue area (less than 2o) represents newly formed grains due to recrystallization. The GOS distribution indicates that there were approximately 50.8% recrystallized grains in the microstructure after rolling. Furthermore, the average value of the kernel average misorientation (KAM) distribution (Fig 3(d)) had a low average KAM value (0.38) due to the annealing treatment, and high KAM values were concentrated along the grain boundaries. Additionally, the pole figure for the body-centered cubic (BCC) structure (Fig 3(e)) showed that the plate developed a rolling texture due to cold rolling [18].
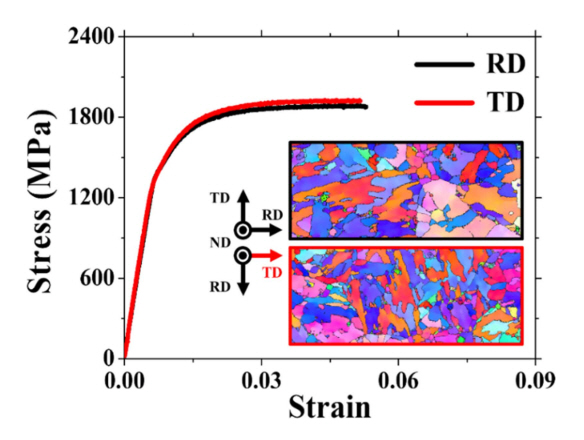
The room temperature tensile properties of the AISI 420 MSS plate in the RD and TD are presented in Fig 4. The yield strength was determined by the 0.2% offset of the relatively low yield point on the curve, and the tensile strength was determined by the maximum point on the curve. The average values of the four tests based on the tensile test results are listed in Table 2. The tensile properties in the RD and TD showed slip-dominated flow. The yield point occurs at a high stress [19], and the yield strengths and elongation at fracture in both directions were almost similar; however, the tensile strength was slightly higher in the TD, by approximately 45 MPa. It is a well-known fact that texture can have a significant impact on tensile properties [20–22]. However, it can be observed that the tensile strength in the TD is higher than in the RD. This is attributed to the fact that the microstructure of the TD specimen has a greater abundance of grain boundaries due to its shorter grain axis length, compared to the RD specimen. Grain boundaries serve as barriers for the absorption or transmission of dislocations; this functions as a strengthening mechanism within the material [23–28]. Thus, it can be inferred that the mechanical properties are not heavily reliant on the anisotropy of the texture. To further understand the mechanical properties of the plate, tensile tests at elevated temperatures (above room temperature) were conducted in the RD to investigate the temperature dependence of the mechanical properties of the MSS plate.
The variations in tensile properties with the temperatures of the specimens along the RD within the operating temperature range are shown in Fig 5. Table 3 presents the average values of the results from three tests. The stress‒strain curves based on the temperature are shown in Fig 5(a). The variations in tensile properties, such as the yield strength, tensile strength, elastic modulus, and elongation with temperature, are shown in Fig 5(b). The overall trend showed a decrease in the measured mechanical properties as the temperature increased. Both the tensile and yield strengths first decreased and then slightly increased with increasing temperature, while the elongation first increased and subsequently decreased. The temperature range where the tensile and yield strengths experienced a sudden increase was assumed to be associated with blue shortness. In carbon steel, it is common for the tensile strength to temporarily increase as the temperature increases due to blue shortness, peaking in a range of 200 °C–300 °C, before decreasing again [29,30]. This phenomenon could be caused by strain agingstrengthening of the material due to the precipitation of carbon or nitrogen when heated. According to reports, this effect should be more noticeable in steels with high carbon contents [30]. Similar to the findings of Zhao et al. [31], the relative increase in yield/tensile strength at 200 °C is estimated to be due to the effect of carbide precipitation from lath martensite. Lath martensite is formed by carbon atoms, which contribute to solid solution strengthening, and numerous dislocations generated by the martensitic transformation [31]. The decrease in elongation at 100 °C is attributed to the reduction in accumulated strain energy caused by the growth of grain boundaries and stress relaxation. When the temperature exceeded 150 °C, a significant decrease in elongation was observed, as shown in Fig 5(b). This suggests the possibility of temper embrittlement due to the formation of more and coarser precipitates with increasing temperature [32,33].
3.2 Fatigue properties of the plate and deformation analysis according to cycle
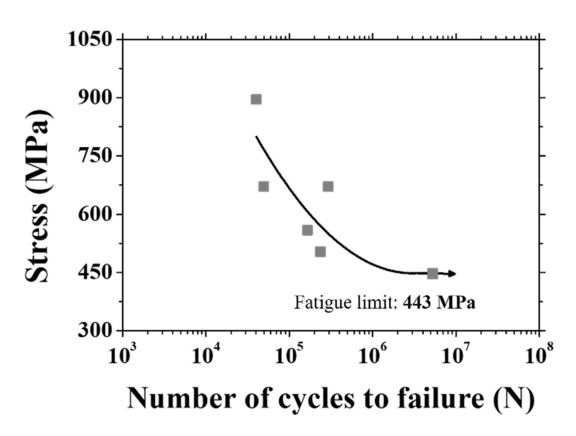
The high cycle fatigue behavior of AISI 420 MSS plates was studied using stress-controlled fatigue tests, and the results are presented in a stress-life graph in Fig 6. The stress life (S–N) curve predicted the fatigue life of AISI 420 MSS plates. It is portrayed on a log-log scale using the Basquin equation representing the relationship between stress amplitude and mean fatigue life in the finite life range [34]. From the results, the fatigue limit of the AISI 420 MSS plates was measured to be 447 MPa. Subsequently, a microstructure analysis of deformation with respect to fatigue cycles at different stress levels was conducted to better understand the results.
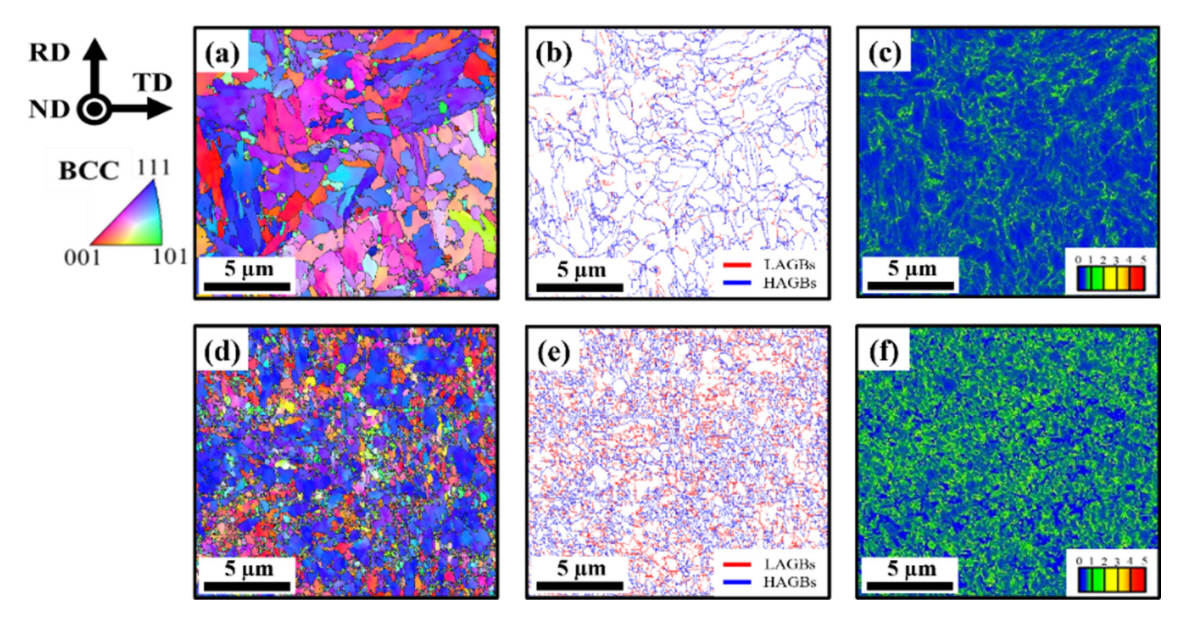
For high-cycle fatigue behavior, the mechanisms of crack initiation and propagation can vary depending on the material. The number of cycles involved in crack initiation is a significant factor to consider when analyzing the fatigue life of a material [35]. In this part of the study, the origins of the differences in the high-cycle fatigue behavior were investigated. The specimens were tested by controlling the cycles at the intermediate stress and fatigue limits. Afterward, the microstructure of the surface of the AISI 420 MSS plate was observed using EBSD analysis. The EBSD results of a specimen with fatigue cycles, controlled at a stress of 671 MPa, are shown in Figs 7(a–c), while the EBSD results of a failed specimen are shown in Fig 7(d–f). The results indicate that the controlled specimen exhibited fewer LAGBs (19.1% (Fig 7(b))) than the failed specimen (48.5%). Additionally, the average value measured from the KAM distribution was 0.43 (Fig 7(c)) for the controlled specimen, which increased to 0.79 (Fig 7(f)) in the failed specimen, indicating the accumulation of deformation within the grains in the failed specimen. Similarly, in the fatigue limit range, the EBSD results of the specimen with controlled fatigue cycles and the failed specimen are presented in Figs 8(a–c) and Figs 8(d– f), respectively. As observed at 671 MPa, the distributions and proportions of LAGBs increased with increasing number of cycles from 18.3% (Fig 8(b)) to 23.2% (Fig 8(e)). A comparison of the average KAM values between Fig 8(c) and Fig 8(f) show that they increased from 0.40 to 0.50, indicating the accumulation of deformation within the grains. Because the stress level at the fatigue limit (447 MPa) was lower than at 671 MPa, fewer LAGBs and a lower KAM average value were observed. Consequently, it was observed that strain was built up within the grains and grain boundaries over the course of the fatigue cycle. This observation confirmed that strain accumulation took place within the specimen as the fatigue cycle progressed. The heightened strain within these samples has the potential to initiate fatigue cracking [36-39].
5. CONCLUSIONS
In this study, the microstructural, tensile, and fatigue properties of an AISI 420 MSS plate were analyzed. Afterward, the correlated effects of the microstructural changes on the fatigue properties of the plate were presented. The results were as follows:
1) The microstructure of the AISI 420 MSS plate underwent rolling deformation. The tensile tests performed along the rolling and transverse directions revealed that the mechanical properties along the rolling direction were inferior to those along the transverse direction, which can be inferred to mean that the mechanical properties are not heavily reliant on the anisotropy of the texture.
2) Tensile tests were performed at various temperatures within the operating temperature range along the RD. From the results, as the temperature increased, the overall tensile and yield strengths first decreased and then increased. Conversely, the elongation decreased with increasing temperature without exhibiting any increases. The phenomenon in which the strengths experienced an increase and a subsequent decrease potentially occurred due to blue shortness.
3) The fatigue limit of the plate was determined through high-cycle fatigue tests; based on the results, the difference in the amount of microstructural deformation was compared and analyzed by controlling the fatigue cycle. The amount of deformation was confirmed to accumulate inside the crystalline structure as the number of cycles increased.


