1. INTRODUCTION
Thermoelectric materials that can directly convert waste heat into electricity have been of interest for decades because of increasing energy demands and environmental problems associated with fossil fuels. However, practical thermoelectric materials, such as Bi2Te3 or PbTe, are not environmentally suitable because of the scarcity and toxicity of their constituent elements [1]. Therefore, eco-friendly thermoelectric materials that can be synthesized using abundant and nontoxic elements are needed. Higher manganese silicides (HMSs) are composed of the two most abundant elements on earth, Mn and Si, and are promising candidates for thermoelectric applications; they are environmentally friendly and have high mechanical, thermal, and chemical resistance [2]. The crystal structure of HMSs is the Nowotny chimney–ladder (NCL) structure, which is characterized by two sublattices; the Mn sublattice is chimney-shaped, and the Si sublattice forms a ladder shape along the c-axis [3].
The performance of a thermoelectric material is evaluated using the dimensionless figure of merit, ZT = α2σκ–1T, where α, σ, κ and T are the Seebeck coefficient, electrical conductivity, absolute temperature, and thermal conductivity, respectively, and α2σ is called the power factor (PF). Ideal thermoelectric materials should have a high Seebeck coefficient, high electrical conductivity, a high PF, and low thermal conductivity. One way to improve ZT is to reduce the lattice thermal conductivity by nanostructuring [4,5] or to enhance the PF by controlling the carrier concentration through chemical doping or elemental substitution [6,7]. The ZT value of HMSs can be improved to ~0.6 by adding dopants such as Cr, Ge, Al, Re, and Ru [8-16]. This improvement generally results from the increased carrier concentration and increased PF due to doping, but in Redoped HMSs, the substitution of heavy elements induces phonon scattering that reduces the lattice thermal conductivity and improves ZT [14,15]. Zhou et al. [10] achieved ZT = 0.6 at 833 K for Mn(Si0.992Ge0.008)1.733, and Luo et al. [17] obtained ZT = 0.65 at 800 K for Mn(Si0.9985Al0.0015)1.80. In our previous work on Ge-doped HMSs, MnSi1.72:Ge0.01 and MnSi1.73:Ge0.03 exhibited ZT = 0.44 and 0.37 at 823 K, respectively [18].
HMSs have been synthesized by arc melting, induction melting, solid-state reaction (SSR), or mechanical alloying, which require considerable time and energy. In addition, the synthesis of MnSi1.75 often produces a metallic impurity phase (MnSi), which degrades the thermoelectric properties [19-22]. SSR has been used to suppress the formation of MnSi [23-25]. In this study, Ge-doped HMS powders (MnSi1.74:Gem and MnSi1.75:Gem) were synthesized by SSR and sintered by hot pressing (HP), and their thermoelectric properties were examined.
2. EXPERIMENTAL PROCEDURE
Elemental powders of Mn (purity 99.9%, <45 μm, LTS), Si (purity 99.99%, <75 μm, Kojundo), and Ge (purity 99.99%, <45 μm, Kojundo) were weighed to obtain stoichiometric compositions of MnSi1.74:Gem and MnSi1.75:Gem (m = 0.01–0.04) and were processed by ball milling for 30 min to obtain a homogeneous mixture. The mixed powder was placed in an alumina crucible and subjected to SSR at 1273 K for 6 h in vacuum. The synthesized HMS powders were classified using a 75 μm sieve and then charged into a graphite mold having an inner diameter of 10 mm and subjected to HP at 1173 K and 70 MPa for 2 h.
The X-ray diffraction (XRD: Bruker D8-Advance) patterns of the powders synthesized by SSR and the sintered bodies formed by HP were obtained using Cu Kα radiation (40 kV, 30 mA, λ = 0.15405 nm) in the θ-2θ mode at a scan step of 0.02° and a scan speed of 3°/min. The lattice constants were calculated by Rietveld refinement (Bruker, TOPAS). Elemental mapping was performed to observe the microstructure of the sintered specimens and to verify the distribution of constituent elements in the specimens using scanning electron microscopy (SEM: FEI Quanta400) with energy-dispersive spectrometry (EDS: Bruker Quantax200).
The thermoelectric properties were measured and estimated in the temperature range from 323 to 823 K. The Seebeck coefficient (α) and electrical conductivity (σ) were measured by the temperature differential and DC four-probe method (Ulvac-Riko, ZEM-3) in He atmosphere:
where kB is the Boltzmann constant, e is the electronic charge, h is the Planck constant, m* is the effective carrier mass, T is the absolute temperature, n is the carrier concentration, and μ is the mobility. Thermal conductivity (κ) was evaluated using Eq. 3 by measuring the thermal diffusivity (D), specific heat (cP), and density (d) by the laser flash method (Ulvac-Riko, TC-9000H):
3. RESULTS AND DISCUSSION
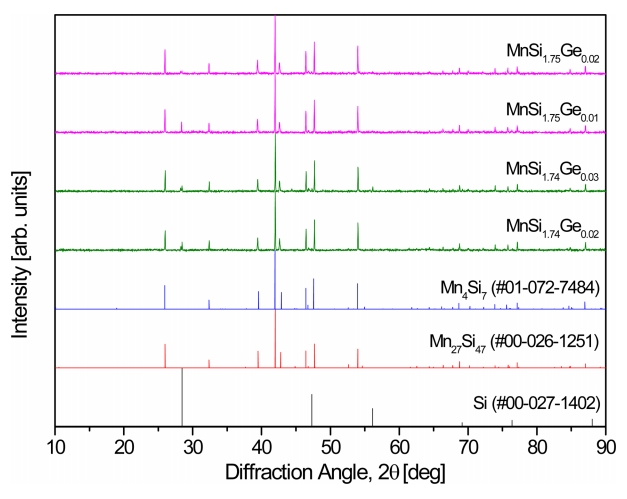
Figure 1 shows the XRD patterns of MnSi1.74:Gem and MnSi1.75:Gem powders synthesized by SSR. The diffraction peaks of MnSi1.74:Gem corresponded to the standard diffraction data (PDF# 00-026-1251) of Mn27Si47, and those of MnSi1.75:Gem matched the standard diffraction data (PDF# 01-072-7484) of Mn4Si7. The desired HMS powders were successfully synthesized without forming the MnSi phase, but residual Si was detected. This is because the dopant Ge was substituted at the Si site, or self-defects, which can also induce the formation of Si vacancies [26].
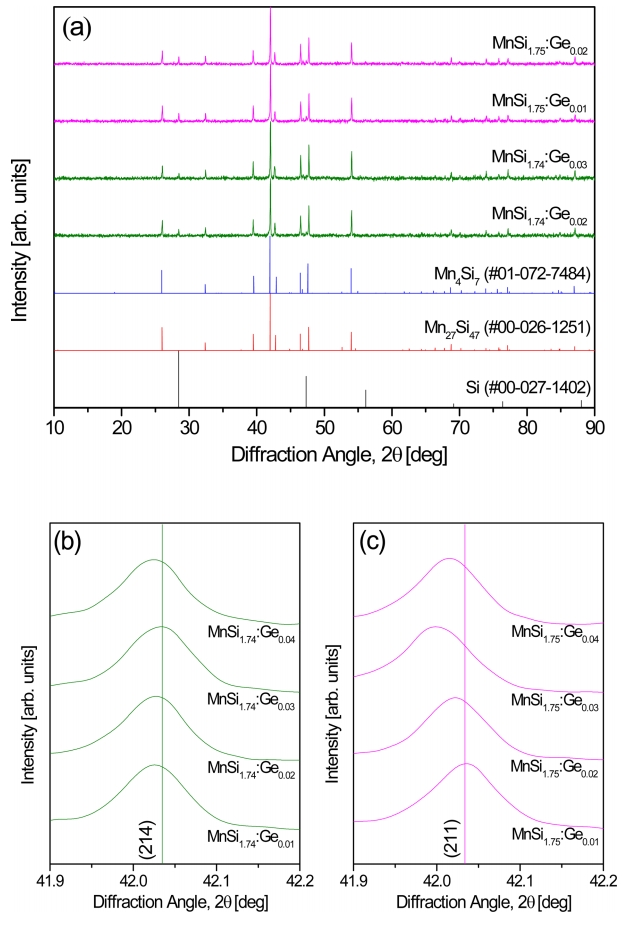
Figure 2 presents the XRD patterns of MnSi1.74:Gem and MnSi1.75:Gem specimens consolidated by HP. The HMS phase was maintained after sintering, and the diffraction peaks shifted to lower angles with increasing Ge doping. Figures 2(b) and 2(c) show the typical peak shifts for the (214) and (211) planes, respectively. Lattice expansion of the HMSs with NCL structure was expected because the lattice constant increased owing to the different covalent radii of Ge (0.122 nm) [27] and Si (0.117 nm) [27]. Table 1 presents the lattice constants of MnSi1.74:Gem and MnSi1.75:Gem. The lattice constants were increased by Ge doping, and the increase on the c-axis was larger than that on the a-axis. Therefore, it was confirmed that Ge-doped HMSs were successfully synthesized by the SSR-HP process.
Figure 3 shows the SEM images and EDS elemental maps of MnSi1.74:Ge0.03 and MnSi1.75:Ge0.01. The specimens had dense and compact sintered bodies in which Mn, Si, and Ge were homogeneously distributed.
Figure 4 presents the temperature dependence of the electrical conductivities of MnSi1.74:Gem and MnSi1.75:Gem. All the specimens behaved like degenerate semiconductors with a negative temperature dependence. The electrical conductivity was increased by Ge doping compared with that of undoped MnSi1.74 [25] and MnSi1.75 [25], and increased at all measured temperatures as the Ge content increased. Al and Cr, which are used as p-type dopants (acceptors) in HMSs, increase the hole concentration and improve the electrical conductivity of the HMSs because they provide fewer valence electrons at the Si sites [12,17]. However, Ge is equivalent to Si, but the increase in hole concentration due to Ge doping results from the change in Si–Si bonds caused by the substitution of Ge for Si and the resulting distortion of the lattice structure [2,10,24,26]. MnSi1.74:Ge0.03 showed the highest electrical conductivities of 3.9 × 10⁴ S m−1 at 323 K and 2.3 × 10⁴ S m−1 at 823 K.
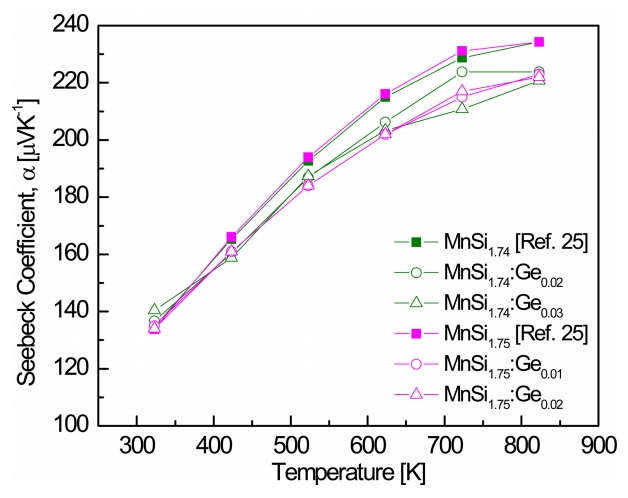
Figure 5 shows the temperature dependence of the Seebeck coefficients of MnSi1.74:Gem and MnSi1.75:Gem. All the Seebeck coefficients were positive in the measured temperature range, indicating that the major charge carriers are holes. The Seebeck coefficients were lower than those of undoped MnSi1.74 and MnSi1.75, probably because of the increase in hole concentration. As shown in Eq. 1, as the temperature increased, the Seebeck coefficient increased, and the carrier concentration increased rapidly owing to an intrinsic transition at a certain temperature. The reduction in the Seebeck coefficient due to the increase in carrier concentration was larger than the increase in the Seebeck coefficient due to rising temperature. As a result, the Seebeck coefficient showed a peak value at a certain temperature. In this study, the temperature dependence of the Seebeck coefficient decreased because of the intrinsic transition at temperatures above 723 K. The Seebeck coefficients of MnSi1.74:Ge0.01 and MnSi1.75:Ge0.02 were 222 μV K−1 at 823 K.
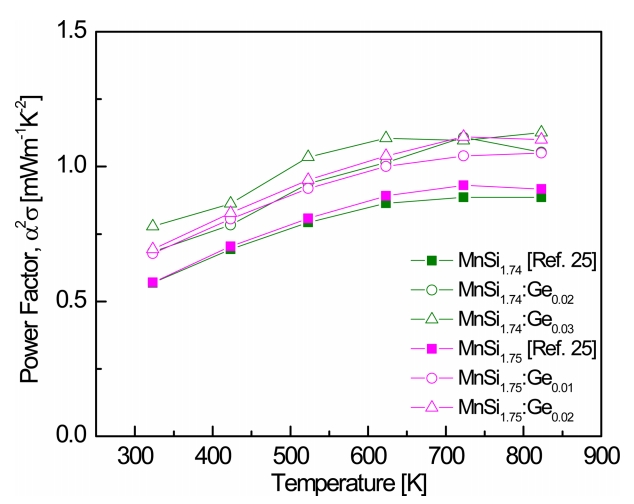
Figure 6 presents the temperature dependence of the PFs of MnSi1.74:Gem and MnSi1.75:Gem. Because the PF has a tradeoff relationship between the electrical conductivity and the Seebeck coefficient, as shown in Eq. 4, a positive temperature dependence appears, and then a peak value appears at a certain temperature. This is the result of the degenerate behavior of the electrical conductivity and the intrinsic transition effect on the Seebeck coefficient. In this study, the PF increased with increasing Ge content owing to the significant enhancement in electrical conductivity and the slightly decreased Seebeck coefficient. MnSi1.74:Ge0.03 showed a maximum PF of 1.12 mW m−1 K−2 at 823 K, and MnSi1.75:Ge0.02 exhibited a maximum PF of 1.11 mW m−1 K−2 at 723 K.
Figure 7 shows the temperature dependence of the thermal conductivities of MnSi1.74:Gem and MnSi1.75:Gem. The thermal conductivity (κ) is expressed as the sum of the electronic thermal conductivity (κe), lattice thermal conductivity (κl), and bipolar thermal conductivity (κbi), which are contributed by the charge carriers, phonon scattering, and bipolar conduction, respectively. Ge substitution can reduce the lattice thermal conductivity due to phonon scattering caused by the difference in the atomic masses of Si (28.08 g mol−1) and Ge (72.59 g mol−1). The thermal conductivity of MnSi1.74:Gem and MnSi1.75:Gem was increased by Ge doping because the decrease in lattice thermal conductivity might be smaller than the increase in electronic conductivity owing to the increase in carrier concentration. As the temperature increased, the thermal conductivity initially decreased and then increased at temperatures above 623 K due to bipolar conduction.
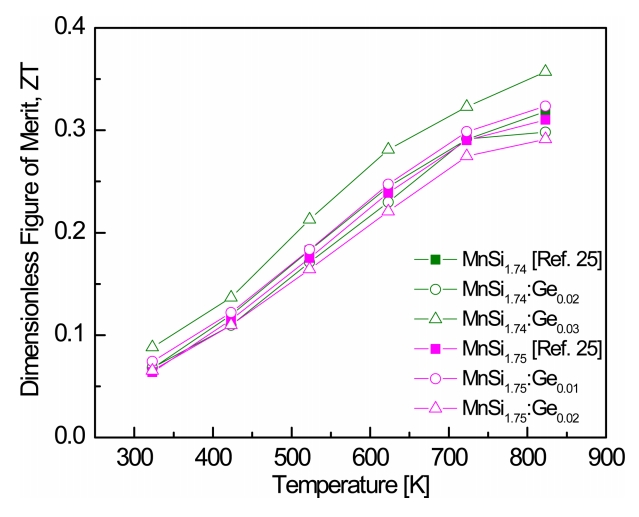
Figure 8 presents the ZT values of MnSi1.74:Gem and MnSi1.75:Gem. In our previous study [25], ZT reached 0.32 and 0.31 at 823 K for undoped MnSi1.74 and MnSi1.75, respectively. As the temperature increased, ZT increased because the PF increased and the thermal conductivity decreased. MnSi1.74:Ge0.03 showed the maximum ZT in the MnSi1.74:Gem system, 0.36 at 823 K, and MnSi1.75:Ge0.01 exhibited the maximum ZT in the MnSi1.75:Gem system, 0.32 at 823 K. The ZT values were compared with data reported in previous studies: ZT = 0.32–0.37 at 823 K for Al-doped MnSi1.74-1.75:Al0.005 [30] and ZT = 0.34–0.35 at 823 K for Cr-doped MnSi1.74-1.75:Cr0.01 [31]. She et al. [32] reported that ZT = 0.62 at 840 K for MnSi1.75Ge0.015, and Okada et al. [33] obtained ZT = 0.50 at 773 K for MnSi1.75Al0.028.
4. CONCLUSION
Ge-doped HMSs MnSi1.74:Gem and MnSi1.75:Gem were successfully prepared by SSR and HP. XRD analysis confirmed that Ge doping expanded the HMS lattice and Ge was substituted at the Si site. The intermetallic MnSi phase was not formed. As the Ge content increased, the electric conductivity and PF increased, which was interpreted to mean an increase in carrier (hole) concentration. However, the Seebeck coefficient was decreased slightly and the thermal conductivity was increased by Ge doping. The dimensionless figure of merit ZT was improved by Ge doping; ZT = 0.36 was achieved at 823 K for MnSi1.74:Ge0.03, and ZT = 0.32 was obtained at 823 K for MnSi1.75:Ge0.01.


