


1. Introduction
Graphene, with its perfect honeycomb structure, is a two-dimensional (2D) material comprised of a single layer of carbon atoms arranged in a hexagonal lattice [1-4]. With its first exfoliation from graphite in 2004, graphene launched a new era in 2D nanomaterial research because of its extraordinary physical, mechanical, electrical, and optical properties [5-8].
Several studies have attempted to improve the mechanical, thermal, and electrical properties of metal matrices by introducing graphene as a nanofiller [9-15]. Wang et al. [16] prepared graphene-reinforced copper matrix composites using high-pressure sintering and showed that the optimum product could be obtained using 0.5 wt% graphene, resulting high in yield stress, thermal and electrical conductivities, and corrosion resistance. Chen et al. [17] dispersed graphene nanoplatelets (GNPs) into a copper matrix, and investigated the effects of graphene on the mechanical, thermal, electrical, and tribological properties of the samples, which were prepared by mixing at the molecular-level and spark plasma sintering. Their experiment showed that the electrical properties of the copper matrix were adversely affected, possibly because of the nonuniform dispersion of the GNPs. Wei et al. [18] fabricated CuŌĆōgraphene nanosheet composites at a relatively low temperature (800 ┬░C) using a hot-pressing method and observed a rough and uneven fracture surface, indicating that the graphene nanosheets were heterogeneously dispersed in the Cu matrix, resulting in anisotropic electrical and thermal behaviors.
Many researchers [19-21] have fabricated graphene-reinforced metal matrix composites using dispersion methods. However, dispersion methods have the following two challenges; (i) a uniform dispersion of graphene in the metal matrix requires overcoming the high-density difference between graphene (~2.25 g cm-3) and copper (~8.960 g cm-3) and (ii) a sufficient amount of interfacial strength must be achieved between the graphene and the metal matrix [22]. To overcome those problems, we used a simple two-step fabrication process to prepare a three-dimensionally interconnected graphene-reinforced Cu (3Di Gr-Cu) composite [23]. The micron-sized Cu particles were first compacted into a disc (compaction process), and then graphene was introduced at the grain boundaries through the CVD process. This simple and economical method was used to synthesize a 3Di Gr-Cu composite with uniformly dispersed graphene surrounding the grains of the metal matrix. The mechanical and thermal properties of the 3Di Gr-Cu composite were previously described [23].
The present research is aimed at exploring the electrical and chemical behaviors of the 3Di Gr-Cu composite, and the influence of graphene on the properties of the metal matrix by analyzing the microstructure, electrical properties, and corrosion behavior of the 3Di Gr-Cu composite.
2. Materials and Methodology
2.1 Synthesis of 3Di Gr-Cu Composites
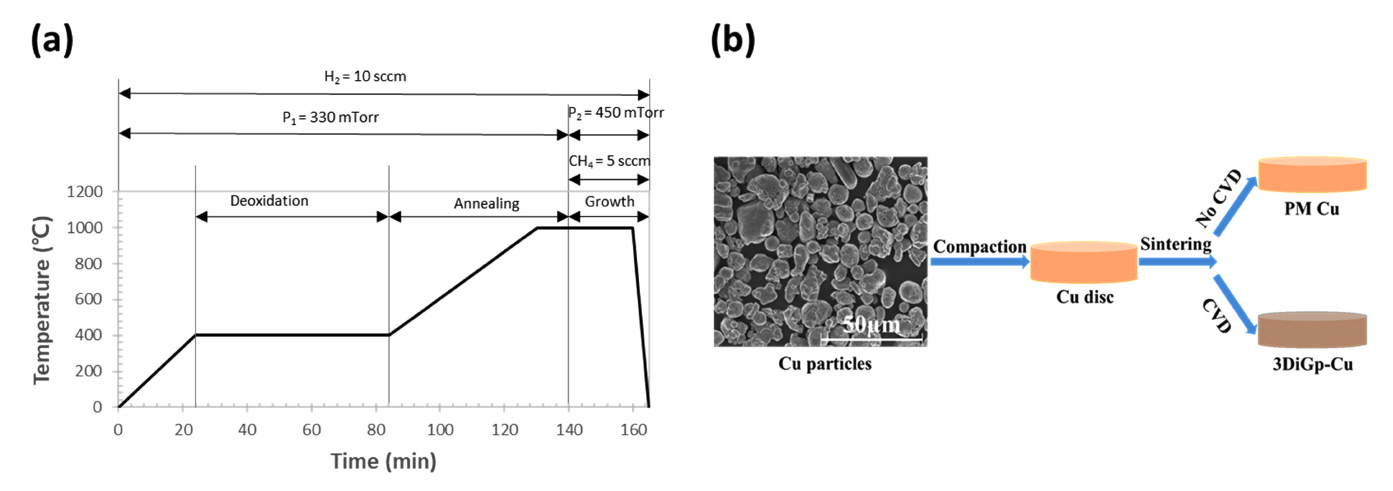
Cu powder (99.5% purity) with 14-25 ┬Ąm spheroidal particles was purchased from Sigma Aldrich. To make compact discs with diameters and thicknesses of ~15 mm and ~1 mm, respectively, the powder was compacted in a double hydraulic press under a compaction pressure of 112 MPa to achieve the maximum density of the composite, as determined in our previous work [23]. The 3Di Gr-Cu composite was synthesized following the experimental conditions shown in Figure 1(a). The fabrication scheme to produce the 3Di Gr-Cu composite and PM Cu is shown in Figure 1 (b). For comparison, a Cu only sample was prepared via powder metallurgy (PM Cu) under the same conditions, except that methane was not introduced into the system (i.e., without CVD).
2.2 Microstructural Characterization
For the microstructural examination, polished and cleaned samples of the 3Di Gr-Cu composite and PM Cu were etched in mixed solutions of 1M FeCl3 and 0.1M HCl to reveal the surface microstructure, which was observed using an optical microscope (OM). A structural phase investigation was conducted via x-ray diffraction using Cu K╬▒1 radiation with a wavelength (╬╗) of 0.154060 nm in the scan range of 5┬░ŌĆō100┬░. To reveal the 3-dimensionally interconnected graphene network (3DIGN), the 3Di Gr-Cu composite sample was placed into the etchant for more than 12 h. When the Cu was completely etched away, the remaining 3DIGN was washed carefully with deionized (DI) water several times. To avoid structural damage due to capillary forces the freeze-drying method was employed to obtain free-standing 3DIGN [24].
2.3 Corrosion Tests
The anticorrosion behavior was evaluated using potentiodynamic polarization experiments, performed on the PM Cu and 3Di Gr-Cu composite in a 3.5 wt% NaCl solution using a potentiostat (BioLogic VMP3). A copper wire was attached using a conductive adhesive to the back of the specimen, which was then mounted with an epoxy resin. The mounted specimen was then mechanically polished using 400-2000 grit SiC abrasive papers.
After fine polishing, each specimen was cleaned ultrasonically with DI water and alcohol for 1 min and dried with N2 gas. A working electrode with an exposed area of 0.28 cm2 on the mounted specimen was marked and the rest of the area was masked with waterproof tape as shown in Figure 2(a). A three-electrode electrochemical cell was constructed using the specimen as the working electrode, a saturated calomel electrode as the reference electrode, and graphite as the counter electrode as shown in Figure 2(b). Experiments were performed at 25 ┬░C in 3.5 wt% NaCl solution, which was degassed earlier with nitrogen gas for 1 h. The corrosion potential (Ecorr) and corrosion current density (Icorr) were determined from the polarization curves using the Tafel extrapolation technique. The measurements were obtained in 1800 s at a scanning rate of 1 mV/s by sweeping the voltage range from ŌłÆ0.3 V to +0.0 V.
A hydrogen-assisted corrosion (HAC) experiment was also performed for the PM Cu and 3Di Gr-Cu composite in a corrosive electrolyte. To prepare a strong acidic electrolyte solution (pH = 0.7), 0.3 g┬ĘmLŌłÆ1 ammonium persulfate ((NH4)2S2O8) was dissolved in DI water and a small amount of nitric acid (HNO3) added to adjust the pH. The disc samples of PM Cu and 3Di Gr-Cu were cut into halves and weighed by an analytical balance with a precision of 0.000 g. The specimen in the electrolyte served as the cathode and the platinum served as the anode in the electrochemical cell. The current of the pulse silicon-controlled rectifier was adjusted to 8.5 A. Every 2 min, the specimen was removed, washed with DI water, dried, and weighed to determine the weight loss as a function of time. A higher weight loss indicates a higher HAC [25]. At least five samples each from the PM Cu and 3Di Gr-Cu composite were tested for corrosion, and the average values were used for the analyses.
2.4 Electrical Conductivity (EC) Measurements
The ECs of PM Cu and 3Di Gr-Cu composite were measured at ~20 ┬░C using a four-point probe contact (FPPC) method [26]. The specimen (L 10 mm ├Ś W 5 mm ├Ś T 1 mm) was cut from the disc sample and the surface was gently polished. Four aluminum wires were attached to the polished surface of each sample using conductive epoxy glue which was cured at 150 ┬░C for 30 min in an H2 atmosphere. Next, the sample was mounted on a circuit board (shown in Figure 9(a)) and the assembly was positioned on the device for measuring direct-current electrical resistivity. The voltage (V) between the inner terminals was measured by varying the current (I) between the outer terminals to obtain the IŌĆōV characteristic curve. The resistances (R) of PM Cu and 3Di Gr-Cu composite were obtained by analyzing the resulting IŌĆōV curve according to OhmŌĆÖs law [27]. The EC (Žā) was calculated as follows [28]:
where Žā denotes the EC, Žü is the resistivity, l is the interelectrode distance, R denotes the slope of the IŌĆōV curve, and A is the cross-sectional area of the sample. The EC tests were performed for five specimens to ensure the repeatability and reproducibility of the measurements.
3. Results and Discussion
3.1 Microstructure of 3Di Gr-Cu Composite
Figure 3 shows the OM images of the PM Cu and 3Di Gr-Cu composite. The average grain sizes of the PM Cu (Figure 3(a)) and the 3Di Gr-Cu composite (Figure 3(b)) were found to be ~50 ┬Ąm and ~40 ┬Ąm, respectively. The difference in grain size could be attributed to the formation of graphene around the Cu grains in the 3Di Gr-Cu composite. The formation of graphene at the grain boundaries acted as a diffusion barrier, thus hindering the further growth of Cu grains during the CVD process [23,29].
Figure 4(a) shows the X-ray diffraction (XRD) spectra of the PM Cu and 3Di Gr-Cu composite. Three distinct characteristic reflection peaks located at 43.31┬░, 50.34┬░, and 74.14┬░ were observed and could be respectively assigned to the (111), (200), and (220) crystal planes (JCPDS No.-04-0836). Figure 4(b) shows an SEM image of the free-standing 3-dimensional (3D) graphene obtained after freeze-drying. The 3D structure of graphene in Figure 4(b) indicates that the graphene was formed at the grain boundaries of various shaped and sized Cu grains, thus confirming the three dimensionally interconnected graphene network (3DIGN) in the 3Di Gr-Cu composite. The 3DIGN is expected to impart excellent thermal, chemical, and mechanical properties to the 3Di Gr-Cu composite [23,30].
3.2 Corrosion Analysis
3.2.1 Electrochemical corrosion (ECC)
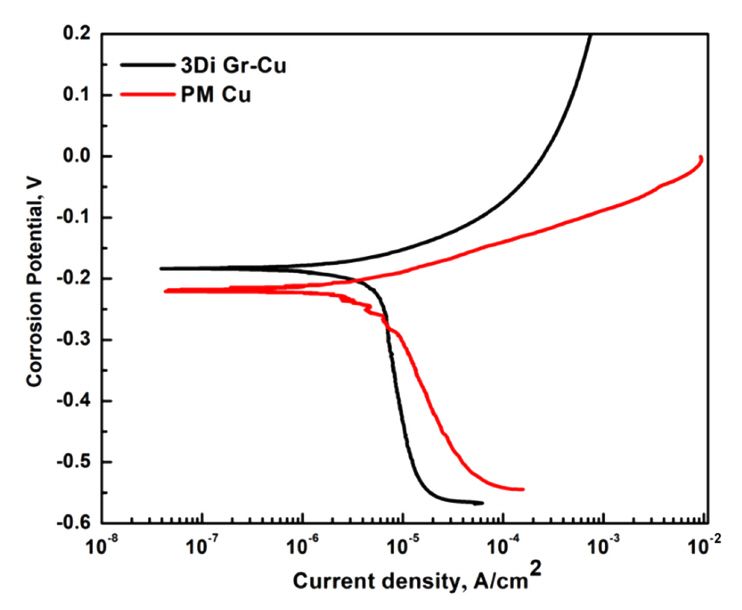
Figure 5 shows the potentiodynamic polarization curves of the PM Cu and 3Di Gr-Cu composite. Compared with the PM Cu, the polarization curve of the 3Di Gr-Cu composite moved in the positive direction of the potential (upward in Figure 5), indicating a higher corrosion potential (Ecorr) [31,32]. The current density (Icorr) and the corrosion potential (Ecorr) were measured using Tafel analysis, in which the extrapolated Tafel curves (representing cathodic and anodic currents) intersect with each other to give Icorr and Ecorr. The Ecorr of the 3Di Gr-Cu composite was ŌłÆ0.185 V, which was higher than that of the PM Cu (ŌłÆ0.220 V).
In corrosion thermodynamics, the higher the value of Ecorr, the better the anticorrosion properties of a material [31,32]. Similarly, a low Icorr value indicates better anticorrosion properties (higher corrosion resistance) [33]. In corrosion kinetics, the corrosion rate (CR) is directly proportional to Icorr; hence, a higher Icorr value would lead to a higher CR. FaradayŌĆÖs law of electrolysis was employed to deduce the CR from the value of Icorr using the following equation [34]:
where M is the atomic weight of Cu (63.5 g), Icorr is expressed in ┬ĄA.cm-2 (Table 1), n is the valency of Cu (2), and D is the density (g┬Ęcm-3) of the corroding material. The densities of PM Cu and 3Di Gr-Cu (8.27 and 8.26 g┬Ęcm-3, respectively) were measured according to ArchimedesŌĆÖ principle [35]. CRs for the PM Cu and 3Di Gr-Cu composite were measured to be 1.33 mm┬Ęyear-1 and 0.95 mm┬Ęyear-1, respectively.
Table 1 presents the electrochemical corrosion parameters obtained from the polarization curves, shown in Figure 5. The decrease in Icorr and CR for the 3Di Gr-Cu composite as compared to PM Cu proves that the 3DIGN provides effective protection against corrosion of the metal matrix.
Because graphene is highly impermeable to ions and molecules, the interconnected graphene at the grain boundaries acts as a charge transfer inhibitor [36] which impedes the free flow of Cu+ ions and H2/O2 across the CuŌĆōelectrolyte interface, and thus reducing the surface area exposed to the corrosion solution [31]. Therefore, the formation of the 3DIGN can effectively reduce the reaction speed and CR of the metal matrix, resulting in the excellent corrosion resistance of the 3Di Gr-Cu composite.
3.2.2 Hydrogen-assisted corrosion (HAC)
Figure 6(a) illustrates the experimental setup for the HAC tests. During the experiment, a positive potential was applied to the anode (Pt), and hydrogen was generated through electrochemical reactions as follows [36]:
Most of the atomic hydrogen spontaneously recombined to form molecular hydrogen (H2), while the remaining portion of the atomic hydrogen diffused into the lattice sites and remained in the material (cathode). However, the diffusivity of atomic hydrogen depends mainly on the nature of the material.
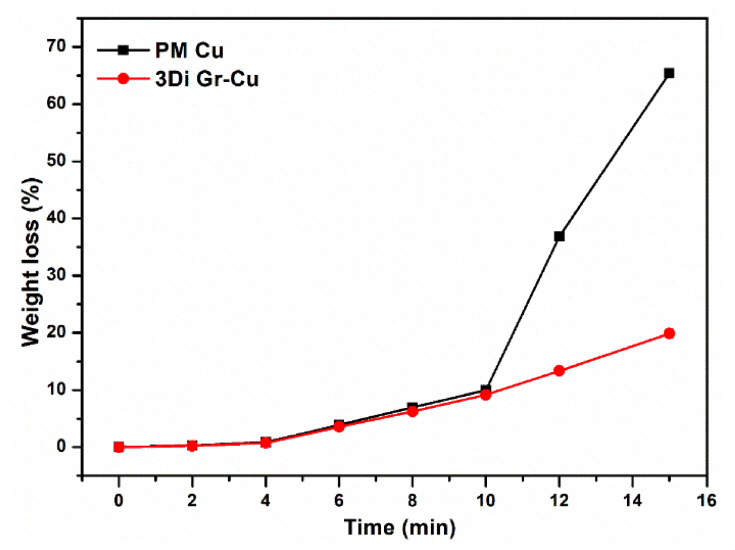
Many studies have shown that graphene is impermeable to atomic hydrogen [36-38]. Therefore, the 3DIGN in 3Di Gr-Cu composite can function as an effective barrier to atomic hydrogen. In contrast, PM Cu is not capable of blocking atomic hydrogen; hence, the corrosion reaction was accelerated by the diffusion of atomic hydrogen at the cathode [25]. In the results shown in Figures 6(b) and (c), before and after the HAC experiment, the PM Cu exhibits more corrosion than the 3Di Gr-Cu composite. Figure 7 shows the weight losses of the specimens vs. time as a result of HAC.
In the experiment, from the beginning to 10 min, the weight losses observed for PM Cu and 3Di Gr-Cu did not differ significantly. This is because the surfaces of both samples were polished, thereby directly exposing the metal surface to HAC. However, after ~ 10 min, the difference in weight loss (%) between the PM Cu and 3Di Gr-Cu composite grew large, as shown in Figure 7. At the end of the experiment (~15 min), the weight losses for the PM Cu and the 3D Gr-Cu composite were calculated to be 67% and 20%, respectively. Notably, the 3Di Gr-Cu exhibited less weight loss than the PM Cu mainly due to the 3DIGN in the 3Di Gr-Cu composite. The 3DIGN, acting as a barrier, prevents hydrogen penetration (diffusivity) into the metal matrix, thereby reducing the HAC. Nam et al. [36] reported similar experimental results, that the graphene-coated copper exhibited a much lower HAC ratio (3.0%) than bare copper (10.1%).
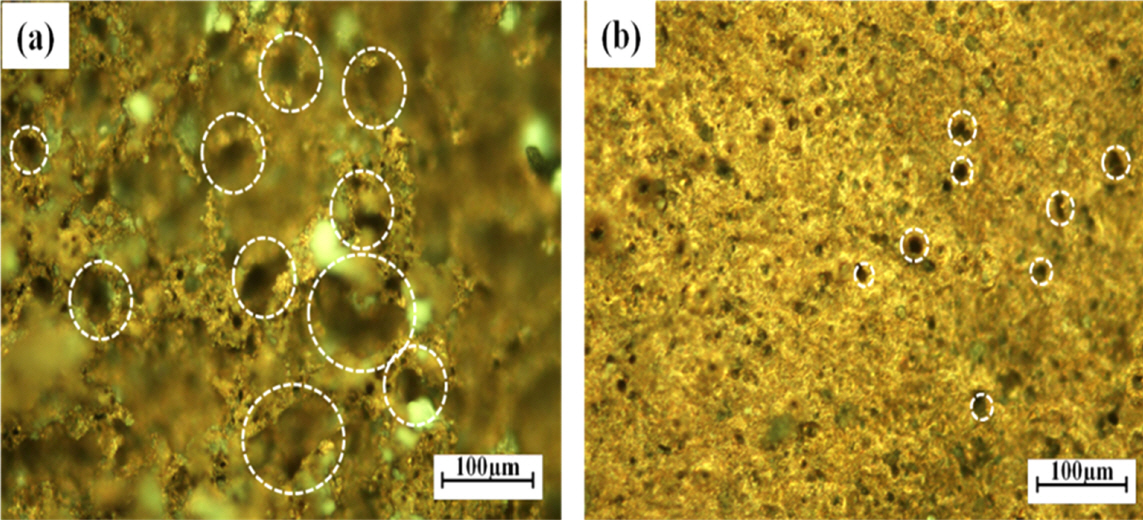
Figure 8 shows OM images of the PM Cu and 3Di Gr-Cu composite samples after the HAC experiment. The dotted white circles in Figure 8 show HAC pits at the surface. A greater volume fraction of pits with an average diameter of 70 ┬Ąm can be observed in the PM Cu in Figure 8(a), while a relatively smaller volume fraction of pits with an average diameter of 20 ┬Ąm is seen for 3Di Gr-Cu in Figure 8(b). This result again confirms that the 3DIGN acted as a barrier to block hydrogen into the metal matrix.
3.3 Electrical Conductivity (EC)
The ECs of the samples containing different amounts of carbon were measured, and the results are shown in Figure 9(a). When the amount of carbon was less than 73 ppm, the graphene network may not have been continuous in the 3Di Gr-Cu composite. The continuity of the graphene network reached its maximum at ~73 ppm of carbon, resulting in a higher EC (38.8 MS┬ĘmŌłÆ1). The gradual decrease in EC above 73 ppm of carbon could be due to the decrease in the electron mean-free path, caused by the increasing number of graphene layers. Nevertheless, the EC of the 3Di Gr-Cu composite even up to 100 ppm of carbon was higher than that of the PM Cu. The carbon contents in the 3Di Gr-Cu composite were measured as a function of density using an ELTRA CS-2000 analyzer with ┬▒ 0.3 ppm precision.
Figure 9(b) presents the EC of the PM Cu and 3Di Gr-Cu composite in the directions parallel (RŌłź) and normal (RŌŖź) to the rolling directions after 50% coldwork. The EC of the 3Di Gr-Cu composite increased by 12.14% and 10.25% in the R Ōłź and RŌŖź directions, respectively, compared with those of the PM Cu. This is because the grains were elongated and had fewer grain boundaries in the RŌłź direction than in the RŌŖź direction.
4. Conclusions
The microstructure, corrosion behavior, and electrical properties of the fabricated 3Di Gr-Cu composite and PM Cu were characterized and can be summarized as follows:
ŌĆó The formation of 3D interconnected graphene in the Cu matrix reduced the corrosion current density and CR by 29% and 40%, respectively, as compared to the PM Cu. This could be attributed to the 3DIGN in the 3Di Gr-Cu composite. The 3DIGN provides high impermeability to ions and molecules, thus effectively blocking them in the 3Di Gr-Cu composite in the ECC experiment.
ŌĆó The HAC experiment showed that the weight loss of the 3Di Gr-Cu composite was approximately one-third that of the PM Cu, mostly due to the interconnected graphene network, which blocked the penetration of atomic hydrogen into the composite.
ŌĆó The EC of the 3Di Gr-Cu composite depended on the carbon content and was found to be highest at 38.8 MS┬ĘmŌłÆ1 with 73 ppm.
ŌĆó The EC of 3Di Gr-Cu composite was found to be approximately 12% higher than that of the PM Cu because the continuous graphene network effectively provided a conduction channel for electron movement.