1. INTRODUCTION
During semiconductor fabrication processing, materials exposed to plasma undergo radical reactions while simultaneously being impacted by positive ions, resulting in plasma etching and the production of various contaminating particles [1-4]. For that reason, plasma-resistant materials must be used for semiconductor processing equipment. The demand for alumina (Al2O3) material, which has near-perfect purity, high density, high plasma resistance, and few surface defects, has grown, since the use of plasma has increased with the scaling of semiconductor processes [5-8]. When using high voltage at a specific high frequency in the semiconductor etching process, materials are needed which have stable electromagnetic wave transmission and minimal leakage current, to withstand the high voltages. Alumina (Al2O3), with its excellent electrical properties and high density, is a good candidate for this application. Currently, alumina (Al2O3) is often utilized in the insulators used for the electrostatic chuck (ESC) bottom-mounted substrate, in the etching and chemical vapor deposition processes used to fabricate semiconductors and displays [9, 10].
Al2O3 is the most widely used ceramic material, and is useful in the semiconductor and battery industries. Al2O3 can be applied to different material parts because of its high strength, thermal and electric insulating properties, and corrosion resistance. High density alumina components are obtained by compressing Al2O3 powder and sintering it at 1700 ┬░C or higher. However, the metals used in various industries have melting points (e.g., Ti: 1610 ┬░C, stainless steel: 1400 ┬░C) which are lower than the generally required sintering temperature of Al2O3. In efforts to sinter Al2O3 at a lower temperature, various sintering methods, such as isostatic pressure, hot press, and gas pressure sintering, have been developed [12-15]. However, these kinds of sintering processes require expensive equipment and involve hazardous processes, while also being limited by the particle size of the manufactured ceramics. As an alternative to introducing a new sintering process, the sintering temperature can be lowered by using a sintering agent. Several additives have currently been used as sintering aids. In general, when a sintering additives such as NiO, SiO2, MnO, FeO, MgO, or TiO2, have been used, a high sintering density can be achieved, even at a relatively lower temperature, and their mechanical properties can be enhanced by controlling their microstructure [16-20].
Although there have been related studies on the doping of porcelain with BaTiO3, which resulted in a low sintering density of less than 3.00 g/cm3, there are still few studies of both the microstructure and sintering behavior when adding additives to Al2O3 for insulating materials [21]. Therefore, in this study, basic alumina sintering behavior was studied, to develop an alumina insulator. The effect of additives and sintering temperature on sintering behavior was analyzed, and the effects of microstructure changes on density and mechanical properties with the addition of TiO2 as a sintering agent to Al2O3, were investigated.
2. EXPERIMENTAL PROCEDURES
Samples used in experiments were Al2O3 (AES-11, Sumitomo Chemical Co., Ltd., Japan, 99.9%, D50 0.43 ┬Ąm) and TiO2 (Shanghai SMEC Enterprise Co., Ltd., China, 99.5%, D50 0.70 ┬Ąm, Batch no. 19090340245). The organic binder used was PEG 8000 (Duksan, South Korea). Figure 1 shows a scanning electron microscope image of the primary particles, which are hundreds of nanometers in size, and secondary particles consisting of aggregated primary particles of the Al2O3 raw material powder, with TiO2 powder added.
To produce sintering specimens, 0.05, 0.5, 1.0, 3.0, and 5.0 wt.% TiO2 were combined and mixed into Al2O3 powder. The total mixed powder was 30 g by weight and was ball milled at 200 rpm for 24 h in wide-mouth bottles (NA-2104-0008, 250 ml) containing 200 g of Al2O3 balls, 70 ml of ethanol, and 0.3 g of organic binder (PEG 8000). The postmix slurry was dried in an oven at 70 ┬░C, and the dried powder was uniaxially pressed at 60 MPa for 1 min. The specimens were uniformly molded int┬░Cylinders with a diameter of 20 mm and thickness of 2 mm, and then sintered at 1400, 1500, or 1600 ┬░C for 2 h.
The shrinkage rate was calculated by comparing the diameter and thickness of the heat-treated sintered bodies at each temperature and before sintering, while the density and porosity were analyzed using the Archimedes principle in pure water. Field emission scanning electron microscopy (FE-SEM; JSM-7500F, JEOL Ltd., JAPAN) was used to analyze the microstructure of the sintered bodies. X-ray diffraction (XRD; D8 Focus, Bruker, Germany) was performed to determine the crystal structure of the sintered bodies. Pure Al2O3 samples sintered at 1400, 1500, and 1600 ┬░C were analyzed t┬░Clearly understand the effect of TiO2 as a sintering additive. Before FE-SEM analysis, the sintered surface was polished, and underwent thermal etching at 1350 ┬░C for 2 h. XRD analysis was performed under the conditions of an angle range of 20ŌĆō80┬░, scan rate of 5o/min, 40 kV, and 40 mA. In addition, the Vickers hardness of the sintered bodies was analyzed using the Vickers hardness test. Hardness was measured with a load of 3 kg (810-165K, Mitutoyo, Japan).
3. RESULTS AND DISCUSSION
3.1 TiO2 content and density change after sintering
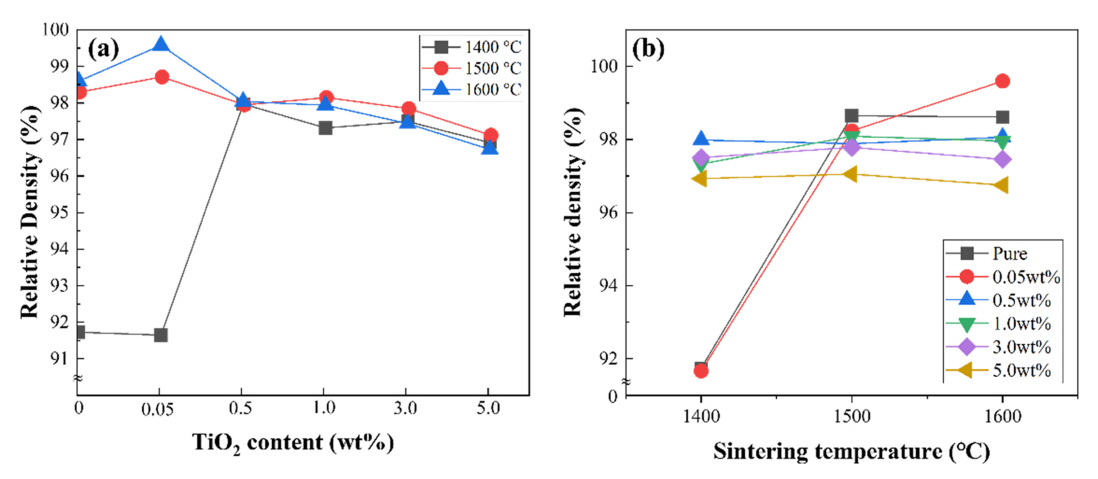
Figure 2(a) shows the relative density of the alumina-sintered bodies heat-treated at various temperatures according to TiO2 concentration. The relative densities were calculated using the theoretical density values of Al, O and Ti, which were 3.95 cm┬│ for Al2O3 and 4.23 cm┬│ for TiO2, respectively. The maximum relative density of 99.6% was observed in the specimen with 0.05 wt.% TiO2, and the lowest relative density was 96.6%, observed in the specimen with 5.0 wt.% TiO2. The change in density showed a similar trend at a sintering temperature of 1500 ┬░C. In contrast, when sintered at a relatively low temperature of 1400 ┬░C, the relative density of the 0.05 wt.% TiO2 specimen was below 92%, an extremely low value compared with the specimens sintered at higher temperatures. However, when 0.5 wt.% or more of TiO2 was added, the density rapidly increased and exhibited values similar to those at higher temperatures.
The change in density with increased TiO2 content can be explained as follows. When a small amount of sintering agent is added, the TiO2 is thought to promote the sintering of Al2O3, even at lower temperatures, which crystallizes quickly, increasing the specimenŌĆÖs density as a result. When the amount of added TiO2 exceeds 0.5 wt.%, the relative density gradually decreases. This is thought to occur because of over-sintering and generation of a secondary phase, due to the presence of TiO2 [22,23]. When the dopants were added to Al2O3, the TiO2 resulted either in atomic segregation at alumina-alumina grain boundaries, or in the formation of various secondary crystalline phases, with a profound influence on the densification of the Al2O3 ceramic. This could also result in lower interpore spacing, generating a large number of pores, degrading the density of the specimens [8,9].
Figure 2(b) shows the changes in relative density according to the sintering temperature with TiO2 content. Observing the density changes of the specimen with 0.05 wt.% of TiO2, the relative density value was 91.7% when sintered at 1400 ┬░C, significantly lower than the relative density values of samples sintered at 1500 ┬░C and 1600 ┬░C, 98.2% and 99.6%, respectively.
When the alumina was thermally treated at 1400 ┬░C, the sample was not sufficiently sintered, due to the low temperature. Raw alumina powder due to incomplete sintering was observed in the microstructure analysis. When pure alumina powder with no sintering was heat-treated at 1400 ┬░C, the sintering pattern was the same as that seen with 0.05 wt.% TiO2. However, when more than 0.5 wt.% of TiO2 is added, sintering became active and proceeded at 1400 ┬░C, producing a higher relative density value.
As described for the case of 1400 ┬░C in this experiment, Al2O3 sintering did not progress completely at this low sintering temperature. However, at a temperature of 1500 ┬░C or higher, sintering proceeded well regardless of the sintering agent content, leading to densification and high relative density values. Moreover, as the content of the sintering agent increased to 0.5 wt.%, the density tended to decrease slightly. Therefore, in terms of density, it was concluded that the optimal sintering temperature and TiO2 content were between 1500 ┬░CŌĆō1600 ┬░C and 0.05 wt.% ŌĆō0.5 wt.%, respectively.
Figure 3 shows the shrinkage rate according to the concentration of the TiO2 additive and heating temperature; the trends at 1500 and 1600 ┬░C are similar but differed from the case at 1400 ┬░C. the specimens with up to 5.0 wt.% TiO2 sintered at 1500 ┬░C and 1600 ┬░C shrunk by 3.0% and 3.8%, respectively, compared to pure Al2O3. As the TiO2 content increased, the decrease was 3.4% on average, as the trends at the two temperatures were similar. However, at 1400 ┬░C, the shrinkage rate increased to a value similar to that of specimens sintered at the other temperatures when 0.5 wt.% or more was added, because the TiO2 did not act as a sintering agent at a lower sintering temperature of 1400 ┬░C.
In summary, the relative density and shrinkage rate according to TiO2 content exhibited the same change trend, and different tendencies were observed when the sintering temperature was varied. Density and shrinkage values were lower at 1400 ┬░C, when 0.05 wt.% or less TiO2 was added. However, when a content of 0.5 wt.% or more was added, TiO2 acted like a sintering aid, and the density and shrinkage rate values rapidly increased. At 1500 ┬░C and 1600 ┬░C, high density and shrinkage values were maintained at all contents, and showed similar patterns. However, when the TiO2 content exceeded 1.0 wt.% or more, it gradually decreased.
3.2 Crystalline structure according to TiO2 content and sintering temperature
XRD analysis was performed to analyze the phase of the sintered bodies based on the TiO2 content and sintering temperature. Figure 4 shows the XRD intensity peaks for pure Al2O3 and those of the Al2O3 specimen containing 0.05 wt.% TiO2 sintered at 1400, 1500, and 1600 ┬░C. In both figures, at 1400 ┬░C the peaks are relatively low in intensity and broad in width, which suggests low crystallinity. However, when the sintering was conducted at a temperature of 1500 ┬░C or higher, the peaks were narrow and high, confirming there was an increase in crystallinity with increasing sintering temperature.
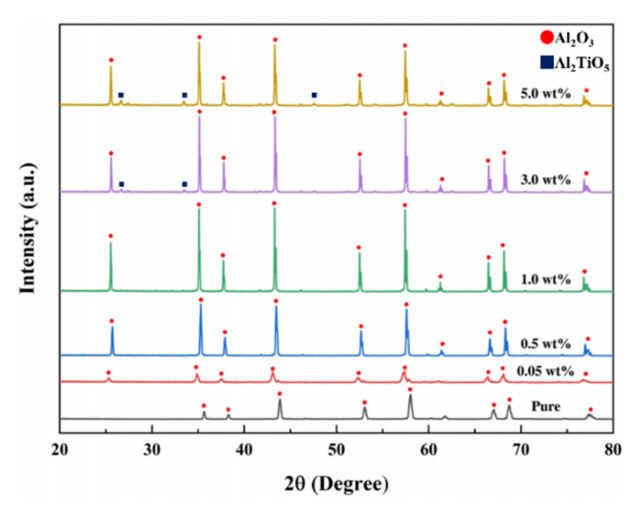
Figure 5 is the result of analyzing the crystal structure using XRD for the sintered samples at 1400 ┬░C. The peaks are compared for the pure Al2O3 specimen and the specimens with 0.05ŌĆō5.0 wt.% TiO2 added. The peaks for the pure Al2O3 specimen and that with 0.05 wt.% TiO2 are relatively low in height and width, suggesting low crystallinity, while specimens with up to 0.5 wt.% TiO2 were confirmed to have high crystallinity, as evidenced by the narrow and high XRD peaks.
Thus, when sintering is performed at 1400 ┬░C, the addition of 0.5 wt.% TiO2 results in good sintering performance as well as an increase in crystallinity and density. In the specimen with 3.0 wt.% or more of added TiO2, a peak corresponding to Al2TiO5 was observed, which is a secondary phase. The peak intensity of the secondary phase is extremely weak; thus, the proportion of this secondary phase is not high. However, it is believed that the formation of the secondary particles with increasing TiO2 content results in a lowering of density. In other words, the formation of the secondary phase during sintering may affect the density. Because the secondary phase peak in this study is extremely weak, it was impossible to quantitatively analyze its effect on density.
3.3 Microstructure changes according to TiO2 content and sintering temperature
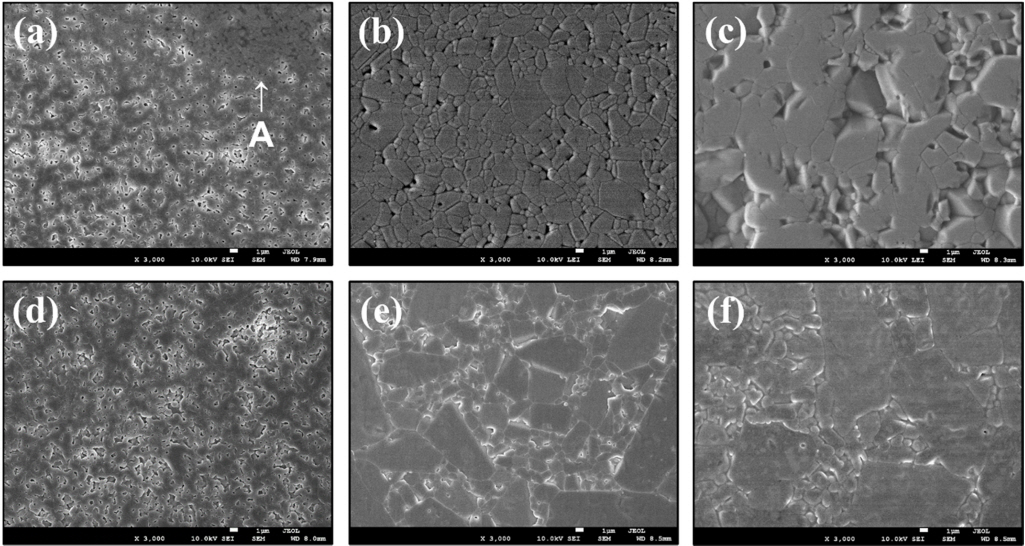
Figures 6(a)ŌĆō(c) and Table 1 show the microstructure of pure Al2O3 samples without sintering aids, sintered at 1400, 1500, and 1600 ┬░C, respectively. After sintering, the average particle size increased to 1.2 ╬╝m at 1400 ┬░C, 3.2 ╬╝m at 1500 ┬░C, and 4.1 ╬╝m at 1600 ┬░C, with no abnormal grain growth.
The microstructure of the pure Al2O3 sample sintered at a temperature of 1400 ┬░C was unique. The Al2O3 particles used as raw materials were not completely sintered, as shown in the area marked by ŌĆśAŌĆÖ in Figure 6(a). Figures 6(d)ŌĆō(f) show the microstructures of the 0.05 wt.% TiO2 -Al2O3 samples sintered at 1400, 1500, and 1600 ┬░C, respectively. As in the pure alumina specimens, the grain size grew as the sintering temperature increased, and sintering did not occur properly at 1400 ┬░C due to the lower sintering temperature.
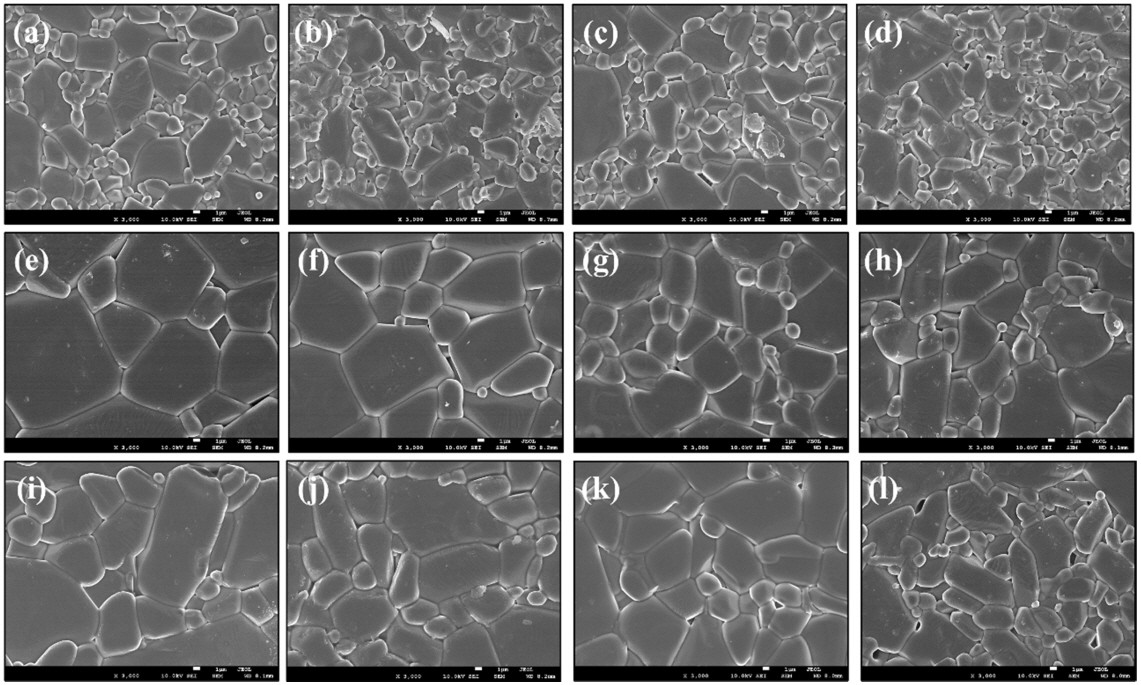
Figures 7(a)ŌĆō(d) show SEM images of the 0.5, 1.0, 3.0, and 5.0 wt.% TiO2 added samples, respectively, with sintering at 1400 ┬░C. When sintered at this temperature, the average particle sizes were 5.5, 4.2, 4.4, and 3.9 ╬╝m, respectively, showing a slight decrease in particle size for the samples with more than 1.0 wt.% of TiO2.
Figures 7(e)ŌĆō(h) show SEM images of samples with 0.5, 1.0, 3.0 and 5.0 wt.% TiO2 added, respectively, with sintering at 1500 ┬░C. Compared to the samples sintered at 1400 ┬░C, the grain growth is relatively even and regular. The average particle sizes for each sample are 11.2, 9.9, 7.4, and 6.8 ╬╝m, respectively, and as observed at 1400 ┬░C, the particle size was largest at 0.5 wt.% and decreased at higher TiO2 content. This can be attributed to the generation of the secondary phase, with increased TiO2 content. Because TiO2 helps Al2O3 grain growth, the particle size for specimens at levels below 1.0 wt.% of TiO2 increased, but the particle size for specimens with more than 1.0 wt.% TiO2 gradually decreased, because the generated secondary phase suppresses particle growth and hinders densification. Figures 7(i)ŌĆō(l) are SEM images of samples sintered at 1600 ┬░C. The average particle sizes were 11.5, 8.9, 7.7, and 6.9 ╬╝m, respectively, all larger than those observed when sintered at 1400 and 1500 ┬░C.
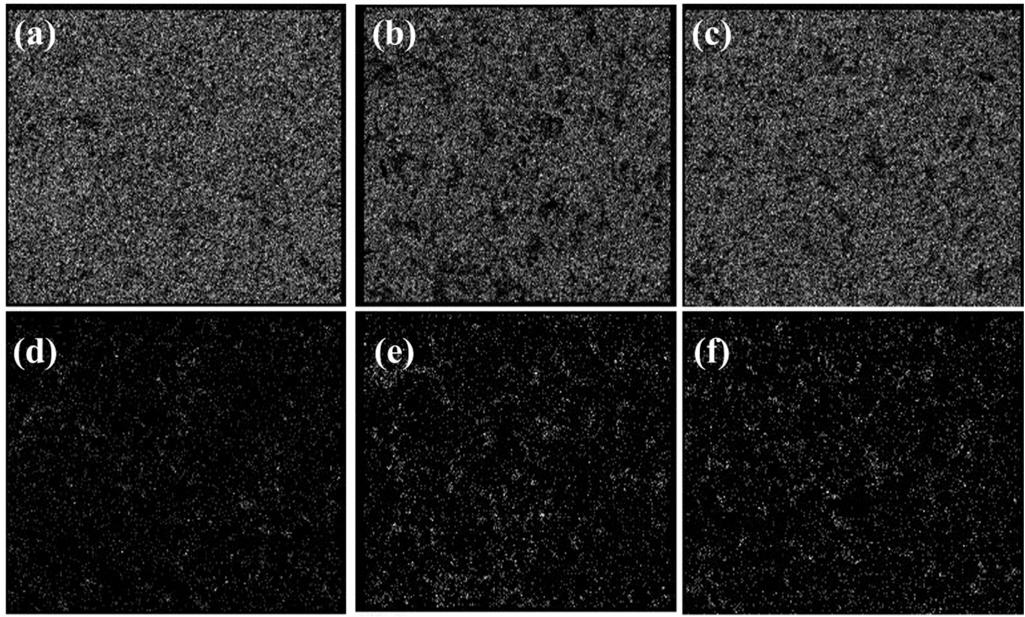
Specimens containing 5.0 wt.% of TiO2 were sintered at 1400, 1500, and 1600 ┬░C, and the results of energy dispersive spectroscopy (EDS) analysis are presented in Figure 8. The Ti was observed to be uniformly distributed throughout the specimen with no clear segregation phenomenon.
3.4 Changes in hardness with sintering agent concentration and temperature
Figure 9 shows the changes in hardness with varying TiO2 content and at different sintering temperatures. Vickers hardness was measured 5 times for each specimen. The error bars are used to indicate the range of standard deviation in the results. At all sintering temperatures, the Vickers hardness values increased as the amount of TiO2 increased, showing the highest value at 1.0 wt.%. The average Vickers hardness value of commercial sintered alumina is reported to be 1300 HV [11]. In this study, the Vickers hardness value of the sample sintered at 1600 ┬░C showed an average value of 1400 HV. The maximum hardness value was 1729 HV for 1.0 wt.% TiO2 sintered at 1600 ┬░C. When TiO2 was not added, the Vickers hardness values varied greatly with sintering temperature, but were similar at 1.0 wt.% TiO2. The largest increase or decrease in the hardness value occurred in a sintered specimen at 1400 ┬░C. The hardness of the specimen with no added TiO2 sintered at 1400 ┬░C was significantly lower than the hardness values under the other conditions.
Comparing the results of hardness testing with density measurements revealed that they followed a similar trend. Depending on the TiO2 content, the hardness value reached a maximum at 0.5ŌĆō1.0 wt.% and a minimum at 3.0ŌĆō5.0 wt.%. The XRD analysis showed that a secondary phase of Al2TiO5 was formed when TiO2 was added at 3.0 wt.% or more. The hardness of the sintered body was considered to have decreased because of the presence of this secondary phase. In addition, the density value of the specimen with low TiO2 content, sintered at 1400 ┬░C, was low. The lower relative density and hardness value are likely caused by the relatively low sintering temperature and insufficient densification. Using these results, the requiring sintering temperature and the TiO2 content required to manufacture alumina-sintered bodies with appropriate mechanical characteristics for an insulator were obtained.
4. CONCLUSIONS
In this study, Al2O3 was sintered while adding TiO2 as a sintering agent, and the following conclusions can be made after analyzing the densification and microstructure characteristics of the sintered bodies thus prepared.
When TiO2 was added to pure Al2O3 at contents between 0.05ŌĆō1.0 wt.% and sintered at a temperature of 1500 ┬░C, the average relative density value was 98% or more, indicating that the addition of 1.0 wt.% TiO2 and below promotes densification of the sintered body.
Microstructure analysis using SEM showed that TiO2 acted as a sintering aid and allowed Al2O3 to be sintered at a lower temperature than originally required. Also, the particle size of the sintered body increased with the addition of up to 0.5 wt.% TiO2, and the particle size gradually decreased when the added amount exceeded 1.0 wt.%. The decrease in particle size can be explained by densification interference due to an increase in secondary phase generation when 1.0 wt.% or more TiO2 was added. This secondary phase generation was confirmed through XRD analysis.
Like the density value, the hardness of the sintered body reached maximum value (1638 HV on average) when the range of added TiO2 was.5 to 1.0 wt.%, and the hardness increased as the relative density value increased, indicating that the internal densification of the specimens affected mechanical properties.
This study confirmed that changes in sintering temperature and TiO2 content affected the microstructure and mechanical properties of the sintered Al2O3 bodies. In addition, TiO2 was observed to act as a significant sintering aid within the range of 0.05 to 1.0 wt.%, and produced a high-hardness, dense Al2O3 insulator.


