


1. INTRODUCTION
Thermoelectric materials have attracted considerable attention as sustainable energy technologies because they can convert a temperature gradient into an electrical potential. Thermoelectric performance is quantified as a dimensionless figure of merit (zT), where high zT values indicate high thermoelectric transfer efficiency. However, improving zT to achieve high thermoelectric performance is challenging. By definition, zT is σ·S2·T/κtot, where σ, S, κtot and T are the electrical conductivity, Seebeck coefficient, thermal conductivity, and absolute temperature, respectively. σ·S2 is referred to as the power factor, and κtot = κelec + κlatt, where κelec is the electronic thermal conductivity and κlatt is the lattice thermal conductivity. Therefore, for a high zT, either the power factor (σ·S2) should be increased or the thermal conductivity (κtot) should be decreased [1-3].
To improve σ·S2, it is necessary to consider the trade-off relationship between σ and S (i.e., S decreases as σincreases), which leads to the determination of the enhanced power factor. In the case of κtot, studies have been conducted to reduce the κlatt. In general, the reduction of κlatt is achieved through structural properties such as two-dimensional layered structures or point-defect phonon scattering [4-6]. For Bi-Tebased materials, the two-dimensional layered structure has a Van der Waals gap in the out-of-plane direction; therefore, the thermal conductivity is low, but the electrical conductivity is high in the in-plane direction [7]. However, this structure only materializes in certain compounds despite exhibiting good anisotropy; therefore, point defects have been introduced in thermoelectric alloys via doping or solid solution method to increase phonon scattering [8,9].
Conventional chalcogenides including Bi2Te3 have been extensively studied as thermoelectric materials. Chalcogenides have semiconducting properties and exhibit high thermoelectric performance by reducing the thermal conductivity via nanostructuring. In particular, transition-metal dichalcogenides have good optical, electrical, magnetic, and transport properties. In addition, in certain transition metal compounds, the effective mass is sometimes large because of the partially filled electrons in the d and f orbitals, which can improve the power factor (σS2 ∝ m*3/2μ), where m* is the effective mass and μ is the mobility [8-10].
To further enhance thermoelectric performance, both the nand p-type thermoelectric materials must have similar zT values. Studies have been conducted to improve the transport properties in p-type materials using mechanisms such as impurity doping, solid solution, and vacancy formation in chalcogenide compounds such as GeTe, Cu2Se, Bi2Te3, SnSe, SnTe and Bi2Te2.7Se0.3 [11-16]. Bi-Te based materials exhibit good thermoelectric performance (zT ≈ 1.8) at room temperature, and the thermoelectric performance of Al-doped Cu2Se increased to zT ≈ 2.6 at a high temperature of 1029 K [12,13]. However, improving the thermoelectric performance of n-type materials requires additional investigation.
Recently, the thermoelectric properties of n-type thermoelectric materials have been improved using the structural properties of Zintl or skutterudites. For example, Ba0.3In0.3Co4Sb12, a skutterudite material, has a zT of approximately 1.8 at 850 K and Mg3.02Y0.02Sb1.5Bi0.5, a Zintltype material, has a zT of approximately 1.8 at 773 K, but poor thermoelectric performance at room temperature [17,18].
Fe-based chalcogenides have also been studied as thermoelectric materials [19-21]. Among Fe-based chalcogenides, FeSe2 has good electrical transport properties with a carrier concentration of 1018-1019 cm-3 [22]. In addition, FeSe2 exhibits a bipolar effect in which the main carrier is inverted at high temperatures [19]. Therefore, obtaining a specific material by enhancing or changing these characteristics is possible.
Based on these conceptualizations, this study was conducted to investigate the electrical and thermoelectric properties of the transition-metal chalcogenide, FeSe2 doped with Ni. The σ, S, Hall carrier concentration, and Hall mobility were measured and the m* was calculated from the S and Hall carrier concentration.
2. EXPERIMENTAL
To synthesize the reference FeSe2 and Ni-doped Fe1-xNixSe2 (x = 0.01, 0.05, 0.075, 0.1, and 0.125) samples, stoichiometric amounts of Fe, Se, and Ni powders were mixed. The samples were synthesized at 560 K for 72 h via a conventional solid-state reaction. High-purity Fe (99.9%, Alfa Aesar), Se (99.999%, KRTLab), and Ni (99.9%, Alfa Aesar) were loaded in a quartz tube (diameter = 15 mm), which was then vacuum sealed (~10-3 Torr). The synthesized ingot was pulverized in a stainless steel container with stainless steel balls using a high-energy ball mill (SPEX 8000D, SPEX) for 5 min to obtain the powders. The bulk sample was fabricated under vacuum (~10-5 Torr) by spark plasma sintering (SPS; SPS-1030, Sumitomo Coal Mining Co., Ltd., Tokyo, Japan) at 530°C for 14 min at 75 MPa.
The crystalline phase analysis of the samples was performed using X-ray diffraction (XRD, D8 Discover, Bruker) at 40 kV and 40 mA. The XRD patterns were recorded in the 2θ range of 20°-80° at a scan rate of 0.02° s-1 using a Cu Kα source, and the lattice parameter was calculated based on the XRD patterns for each synthesized sample. The thermoelectric properties S and σ were simultaneously measured over a temperature range of 300-600 K in a direction parallel to the SPS pressing direction, using a thermoelectric property measurement instrument (ZEM-3, Advanced-Riko, Yokohama, Japan). The error margins for σ and S were less than 3% and 5%, respectively. Hall measurements were performed at room temperature in the same direction using the Van der Pauw method to determine carrier concentration (nH) and mobility (μH). The κtot value of the sample was calculated using the theoretical density (ρs), heat capacity (Cp), and thermal diffusivity (λ) (κtot = ρs·Cp·λ). Further, ρS of FeSe2 was 7.09 g/cm3 and Cp was measured using a differential scanning calorimeter (DSC8000, Perkin Elmer, Waltham, USA). The λ value was measured in the temperature range of 300-600 K along the pressing direction, using the laser flash method (LFA457, Netzsch, Selb, Germany). The error margin for λ was less than 7%. Accordingly, zT was evaluated based on data measured in the SPS pressing direction. The error margin for zT would be less than 15%.
3. RESULTS AND DISCUSSION
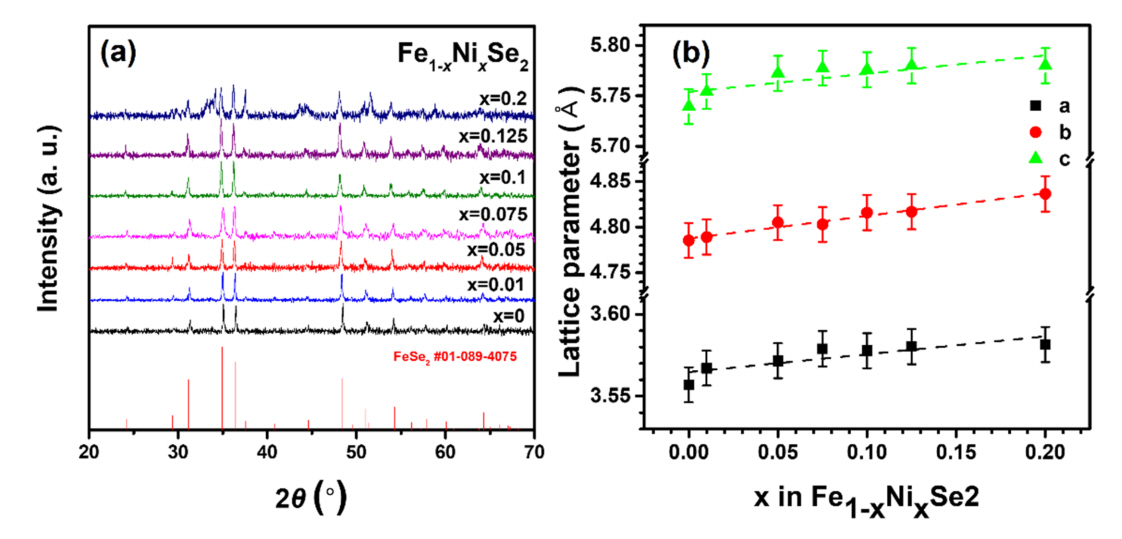
Figure 1(a) shows the XRD patterns of the synthesized Fe1-xNixSe2 (x = 0, 0.01, 0.05, 0.075, 0.1, 0.125, and 0.2) samples. From the XRD patterns, except for the doping level of x = 0.2, a single phase of FeSe2 with a marcasite structure was confirmed without a Ni-related secondary phase. However, secondary phases including Fe2NiSe4 were observed in the x = 0.2 sample, which suggests that the Ni atoms were not well doped in the FeSe2 alloy after doping with x = 0.2. Therefore, subsequent measurements were performed, except for the x = 0.2 sample. The lattice parameters a, b, and c are shown in Fig 1(b) and were calculated using the (111), (012), and (121) diffraction peaks. The lattice parameters increased systematically with increasing Ni doping levels. This is because the ionic radius of Ni2+ is 0.72 Å, which is larger than that of Fe3+ (0.65 Å) [23,24].
Figure 2 shows the measured σ and S values at different temperatures and the calculated power factor. The σ values (Fig 2(a)-(d)) systematically increased from 8.52 (undoped) to 328.78 S/cm (x = 0.125) at 300 K, with increasing Ni doping level, by approximately 38.6 times. The S plot of the undoped FeSe2 sample (Fig 2(b)) shows that a bipolar effect occurs, in which the main carrier is reversed between 400 and 450 K, but the Ni-doped samples had no bipolar effect and were converted to n-type semiconductors (Fig 2(e)).
In addition, the plot of the sample with a doping level x = 0.01 was abnormal; this phenomenon could be caused by the conversion to an n-type semiconductor. That is, it can be described as an intermediate composition converted to ntype. The S values of the Fe1-xNixSe2 samples systematically decreased from -70.31 to -36.71 μV/K at 300 K, from the doping level, x = 0.05 to x = 0.125 due to the trade-off relationship with σ. Consequently, due to the bipolar effect, the power factor of the undoped FeSe2 (Fig 2(c)) showed the highest values of 0.120 and 0.796 mW/mK2 at 300 K and 600 K, respectively.
In the case of the power factor of the Ni doped-FeSe2 samples, at 300-500 K, the doping level of x = 0.1 showed a maximum value of 0.049-0.287 mW/mK2, and the power factor of x = 0.01 became larger at subsequent temperatures. The average power factor values calculated over the entire temperature range are also shown in the inset of Fig 2(f). The average power factor had a maximum value at x = 0.1, except for undoped FeSe2, which exhibited a bipolar effect.
Figures 3(a) and 3(b) show the logarithmic σ plotted against 1000/T and the calculated activation energy (Ea), respectively. Because Ea is proportional to the negative slope for σin Fig 3(a), it was calculated using the Arrhenius relationship, σ ∝ exp(-Ea/kT), where k is the Boltzmann constant; the Ea values are plotted for the 300-400 K and 400-600 K temperature ranges. The Ea values gradually decreased with increasing doping levels at all temperature ranges and had higher values at higher temperatures than at lower temperatures.
Figure 3(c) shows the Hall carrier concentration (nH), where nH is expressed as the hole concentration (nh) for undoped FeSe2 and the electron concentration (ne) for n-type Ni-doped FeSe2. The absolute nH values of Fe1-xNixSe2 gradually increased from 1.44 × 10¹⁹ (x = 0) to 9.54 × 1020 cm-3 (x = 0.125), which suggests that the nH values systematically increased with doping level. As shown in Fig 3(d), the μH values significantly decreased from 3.51 (x = 0) to 0.60 cm2/Vs (x = 0.01) at 300 K due to the significant increase in carrier concentration. However, for doping levels, x = 0.01 to x = 0.125, μH increased systematically at 300 K from 0.60 (x = 0.01) to 2.13 cm2/Vs (x = 0.125).
Figures 3(e) and 3(f) show the effective mass and log10(nH) as a function of S, at 300 K, for the Fe1-xNixSe2 samples. The solid line in Figure 3(f) was calculated using the following equations for nH and S for different effective masses:
For all samples, the plots were inferred numerically using Equation (1), and the md* values were maximum at x = 0.1 [25]. Further, as shown in Fig 2, the electrical conductivity almost doubled with an increase in doping level from x = 0.075 to x = 0.1; however, the Seebeck coefficient did not significantly increase. These results indicate that md* was modified in favor of S at a doping level of x = 0.1.
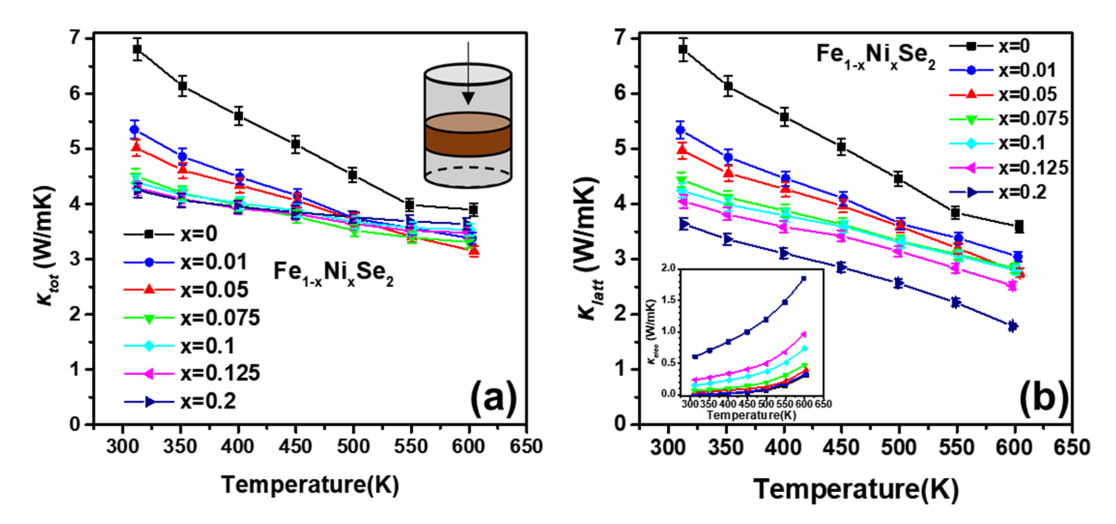
Figure 4(a) and (b) show the plots of κtot and κlatt, respectively. the plot of κelec is given in the inset of Fig 4(b), where κelec is calculated using the Wiedemann-Franz equation.
where L denotes the Lorenz number. As shown in Fig 4(a), at 300 K, κtot systematically decreased from 6.81 to 4.29 W/mK, but at temperatures above 500 K, the trend changed because the slope of κtot increased with increasing doping level.
To elucidate these phenomena, κlatt and κelec were analyzed. κlatt increased with the doping level and had a greater negative slope in the range of x = 0-0.05 than in the range of x = 0.075-0.125. In addition, κelec became more significant at higher doping levels. Therefore, according to the thermal conductivity relationship (κtot = κelec + κlatt), the tendency of thermal conductivity was reversed at high temperatures.
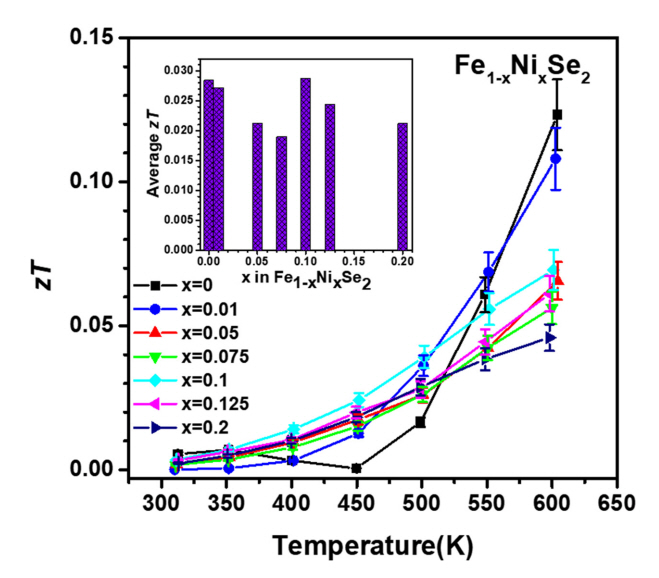
The zT values of the Ni-doped FeSe2 samples were calculated using the experimentally measured values of σ, S and κtot, and are shown in Fig 5. A zT of 0.11 was observed at x = 0.01 at 600 K, while the zT of other Ni-doped samples were 0.056-0.069 at 600 K. Even though the maximum zT shown for the pristine FeSe2 sample (x = 0) at 600 K was not further enhanced by the Ni doping, despite the κlatt decrease, the average zT (zTavg) of the sample with x = 0.01 at all temperatures had the highest value of 0.029, as shown in the inset of Fig 5.
4. CONCLUSIONS
The thermoelectric properties of Ni-doped Fe1-xNixSe2 (x = 0, 0.01, 0.05, 0.075, 0.1, and 0.125) alloys were analyzed. Ni doping in FeSe2 alloys induced n-type conduction over the entire temperature range, as FeSe2 alloys exhibited both ntype and p-type conduction at different temperatures. Further, the electrical conductivity increased by approximately 40 times, from 8.52 (x = 0) to 329 S/cm (x = 0.125), with the increase in carrier concentration. In addition, the activation energy decreased with increasing doping levels, and the effective mass was maximized at x = 0.1. Therefore, the average power factor at x = 0.1 had the highest value except for undoped FeSe2. The total thermal conductivity was decreased by Ni doping, from 6.81 to 4.29 W/mK, while the lattice thermal conductivity also decreased. Consequently, the sample with x = 0.1 had the highest average zT of approximately 0.029.